ocr
Wednesday 12 June 2024 – Afternoon
A Level Geology
H414/02 Scientific literacy in geology
Time allowed: 2 hours 15 minutes
You can use:
an HB pencil
a protractor
a ruler (cm/mm)
a scientific or graphical calculator
Please write clearly in black ink. Do not write in the barcodes.
Centre number Candidate number
First name(s)
INSTRUCTIONS
Last name
• Use black ink. You can use an HB pencil, but only for graphs and diagrams.
• Write your answer to each question in the space provided. If you need extra space use
the lined pages at the end of this booklet. The question numbers must be clearly shown.
• Answer all the questions.
• Where appropriate, your answer should be supported with working. Marks might be
given for using a correct method, even if your answer is wrong.
INFORMATION
• The total mark for this paper is 100.
• The marks for each question are shown in brackets [ ].
• Quality of extended response will be assessed in questions marked with an asterisk (*).
• This document has 24 pages.
ADVICE
• Read each question carefully before you start your answer.
Turn over
final
, 2
1
(a)
(i) Draw a fully labelled diagram to show the processes of saltation and traction along a river bed.
[2]
(ii) Given a constant flow velocity, explain how particles of the same grain size can be transported
by saltation or suspension.
..........................................................................................................................................................
................................................................................................................................................... [1]
(b) Describe the differences between sediments which are texturally mature and texturally immature.
Explain how sediments become texturally mature.
..........................................................................................................................................................
..........................................................................................................................................................
..........................................................................................................................................................
..........................................................................................................................................................
..........................................................................................................................................................
................................................................................................................................................... [3]
final
, 3
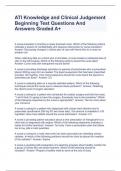
(c) The Hjulström curve graph shows the relationship between the grain size of a sediment and the
flow velocity required for erosion, transportation and deposition.
1000
Erosion
100
Flow
velocity 10
(cm s–1)
Transport Deposition
1
0.1
0.001 0.01 0.1 1 10 100 1000
Grain size (mm)
(i) State the minimum flow velocity required to erode a grain size of 1 mm.
Minimum flow velocity = ...................... Unit =.......................[1]
(ii) State the maximum grain size that would be deposited if the flow velocity slowed to 2 cm s–1.
Maximum grain size = ...................... Unit =.......................[1]
(iii) Explain why both axes of the Hjulström curve graph use logarithmic scales.
..........................................................................................................................................................
................................................................................................................................................... [1]
final Turn over
Wednesday 12 June 2024 – Afternoon
A Level Geology
H414/02 Scientific literacy in geology
Time allowed: 2 hours 15 minutes
You can use:
an HB pencil
a protractor
a ruler (cm/mm)
a scientific or graphical calculator
Please write clearly in black ink. Do not write in the barcodes.
Centre number Candidate number
First name(s)
INSTRUCTIONS
Last name
• Use black ink. You can use an HB pencil, but only for graphs and diagrams.
• Write your answer to each question in the space provided. If you need extra space use
the lined pages at the end of this booklet. The question numbers must be clearly shown.
• Answer all the questions.
• Where appropriate, your answer should be supported with working. Marks might be
given for using a correct method, even if your answer is wrong.
INFORMATION
• The total mark for this paper is 100.
• The marks for each question are shown in brackets [ ].
• Quality of extended response will be assessed in questions marked with an asterisk (*).
• This document has 24 pages.
ADVICE
• Read each question carefully before you start your answer.
Turn over
final
, 2
1
(a)
(i) Draw a fully labelled diagram to show the processes of saltation and traction along a river bed.
[2]
(ii) Given a constant flow velocity, explain how particles of the same grain size can be transported
by saltation or suspension.
..........................................................................................................................................................
................................................................................................................................................... [1]
(b) Describe the differences between sediments which are texturally mature and texturally immature.
Explain how sediments become texturally mature.
..........................................................................................................................................................
..........................................................................................................................................................
..........................................................................................................................................................
..........................................................................................................................................................
..........................................................................................................................................................
................................................................................................................................................... [3]
final
, 3
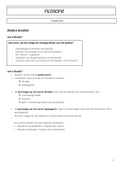
(c) The Hjulström curve graph shows the relationship between the grain size of a sediment and the
flow velocity required for erosion, transportation and deposition.
1000
Erosion
100
Flow
velocity 10
(cm s–1)
Transport Deposition
1
0.1
0.001 0.01 0.1 1 10 100 1000
Grain size (mm)
(i) State the minimum flow velocity required to erode a grain size of 1 mm.
Minimum flow velocity = ...................... Unit =.......................[1]
(ii) State the maximum grain size that would be deposited if the flow velocity slowed to 2 cm s–1.
Maximum grain size = ...................... Unit =.......................[1]
(iii) Explain why both axes of the Hjulström curve graph use logarithmic scales.
..........................................................................................................................................................
................................................................................................................................................... [1]
final Turn over