woensdag 12 december 2018 00:05:32 1
The FREQ Procedure
Country
Cumulative Cumulative
CNTRY Frequency Percent Frequency Percent
Germany 2751 100.00 2751 100.00
Responsible for supervising other employees
Cumulative Cumulative
JBSPV Frequency Percent Frequency Percent
Yes 872 33.97 872 33.97
No 1695 66.03 2567 100.00
Frequency Missing = 184
Allowed to decide how daily work is organised
Cumulative Cumulative
WKDCORGA Frequency Percent Frequency Percent
I have/had no influence 314 12.28 314 12.28
1 49 1.92 363 14.19
2 109 4.26 472 18.45
3 103 4.03 575 22.48
4 74 2.89 649 25.37
5 231 9.03 880 34.40
6 135 5.28 1015 39.68
7 258 10.09 1273 49.77
8 392 15.32 1665 65.09
9 249 9.73 1914 74.82
I have/had complete control 644 25.18 2558 100.00
Frequency Missing = 193
Allowed to influence policy decisions about activities of organisation
Cumulative Cumulative
IORGACT Frequency Percent Frequency Percent
I have/had no influence 915 35.85 915 35.85
1 149 5.84 1064 41.69
2 195 7.64 1259 49.33
3 142 5.56 1401 54.90
4 95 3.72 1496 58.62
5 220 8.62 1716 67.24
6 126 4.94 1842 72.18
7 182 7.13 2024 79.31
8 150 5.88 2174 85.19
Frequency Missing = 199
, woensdag 12 december 2018 00:05:32 2
The FREQ Procedure
Allowed to influence policy decisions about activities of organisation
Cumulative Cumulative
IORGACT Frequency Percent Frequency Percent
9 58 2.27 2232 87.46
I have/had complete control 320 12.54 2552 100.00
Frequency Missing = 199
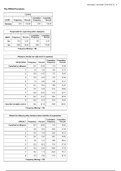
How often socially meet with friends, relatives or colleagues
Cumulative Cumulative
SCLMEET Frequency Percent Frequency Percent
Never 31 1.13 31 1.13
Less than once a month 172 6.26 203 7.38
Once a month 302 10.99 505 18.37
Several times a month 775 28.19 1280 46.56
Once a week 477 17.35 1757 63.91
Several times a week 764 27.79 2521 91.71
Every day 228 8.29 2749 100.00
Frequency Missing = 2
Take part in social activities compared to others of same age
Cumulative Cumulative
SCLACT Frequency Percent Frequency Percent
Much less than most 233 8.57 233 8.57
Less than most 801 29.47 1034 38.04
About the same 1218 44.81 2252 82.86
More than most 418 15.38 2670 98.23
Much more than most 48 1.77 2718 100.00
Frequency Missing = 33
How happy are you
Cumulative Cumulative
HAPPY Frequency Percent Frequency Percent
Extremely unhappy 17 0.62 17 0.62
1 19 0.69 36 1.31
2 35 1.28 71 2.59
3 80 2.92 151 5.51
4 74 2.70 225 8.21
5 315 11.50 540 19.72
6 226 8.25 766 27.97
7 529 19.31 1295 47.28
8 790 28.84 2085 76.12
Frequency Missing = 12
, woensdag 12 december 2018 00:05:32 3
The FREQ Procedure
How happy are you
Cumulative Cumulative
HAPPY Frequency Percent Frequency Percent
9 412 15.04 2497 91.16
Extremely happy 242 8.84 2739 100.00
Frequency Missing = 12
Member of a group discriminated against in this country
Cumulative Cumulative
DSCRGRP Frequency Percent Frequency Percent
Yes 126 4.60 126 4.60
No 2612 95.40 2738 100.00
Frequency Missing = 13
Legal marital status
Cumulative Cumulative
MARITALA Frequency Percent Frequency Percent
Married 1511 55.15 1511 55.15
In a civil partnership 56 2.04 1567 57.19
Separated (still legally married) 41 1.50 1608 58.69
Separated (still in a civil partnership) 1 0.04 1609 58.72
Divorced 232 8.47 1841 67.19
Widowed 194 7.08 2035 74.27
Formerly in civil partnership, now dissolved 4 0.15 2039 74.42
Formerly in civil partnership, partner died 2 0.07 2041 74.49
Never married and never in civil partnership 699 25.51 2740 100.00
Frequency Missing = 11
, woensdag 12 december 2018 00:05:32 4
The FREQ Procedure
Country
Cumulative Cumulative
CNTRY Frequency Percent Frequency Percent
DE 2751 100.00 2751 100.00
Responsible for supervising other employees
Cumulative Cumulative
JBSPV Frequency Percent Frequency Percent
1 872 33.97 872 33.97
2 1695 66.03 2567 100.00
Frequency Missing = 184
Allowed to decide how daily work is organised
Cumulative Cumulative
WKDCORGA Frequency Percent Frequency Percent
0 314 12.28 314 12.28
1 49 1.92 363 14.19
2 109 4.26 472 18.45
3 103 4.03 575 22.48
4 74 2.89 649 25.37
5 231 9.03 880 34.40
6 135 5.28 1015 39.68
7 258 10.09 1273 49.77
8 392 15.32 1665 65.09
9 249 9.73 1914 74.82
10 644 25.18 2558 100.00
Frequency Missing = 193
Allowed to influence policy decisions about activities of
organisation
Cumulative Cumulative
IORGACT Frequency Percent Frequency Percent
0 915 35.85 915 35.85
1 149 5.84 1064 41.69
2 195 7.64 1259 49.33
3 142 5.56 1401 54.90
4 95 3.72 1496 58.62
5 220 8.62 1716 67.24
6 126 4.94 1842 72.18
7 182 7.13 2024 79.31
8 150 5.88 2174 85.19
Frequency Missing = 199
The FREQ Procedure
Country
Cumulative Cumulative
CNTRY Frequency Percent Frequency Percent
Germany 2751 100.00 2751 100.00
Responsible for supervising other employees
Cumulative Cumulative
JBSPV Frequency Percent Frequency Percent
Yes 872 33.97 872 33.97
No 1695 66.03 2567 100.00
Frequency Missing = 184
Allowed to decide how daily work is organised
Cumulative Cumulative
WKDCORGA Frequency Percent Frequency Percent
I have/had no influence 314 12.28 314 12.28
1 49 1.92 363 14.19
2 109 4.26 472 18.45
3 103 4.03 575 22.48
4 74 2.89 649 25.37
5 231 9.03 880 34.40
6 135 5.28 1015 39.68
7 258 10.09 1273 49.77
8 392 15.32 1665 65.09
9 249 9.73 1914 74.82
I have/had complete control 644 25.18 2558 100.00
Frequency Missing = 193
Allowed to influence policy decisions about activities of organisation
Cumulative Cumulative
IORGACT Frequency Percent Frequency Percent
I have/had no influence 915 35.85 915 35.85
1 149 5.84 1064 41.69
2 195 7.64 1259 49.33
3 142 5.56 1401 54.90
4 95 3.72 1496 58.62
5 220 8.62 1716 67.24
6 126 4.94 1842 72.18
7 182 7.13 2024 79.31
8 150 5.88 2174 85.19
Frequency Missing = 199
, woensdag 12 december 2018 00:05:32 2
The FREQ Procedure
Allowed to influence policy decisions about activities of organisation
Cumulative Cumulative
IORGACT Frequency Percent Frequency Percent
9 58 2.27 2232 87.46
I have/had complete control 320 12.54 2552 100.00
Frequency Missing = 199
How often socially meet with friends, relatives or colleagues
Cumulative Cumulative
SCLMEET Frequency Percent Frequency Percent
Never 31 1.13 31 1.13
Less than once a month 172 6.26 203 7.38
Once a month 302 10.99 505 18.37
Several times a month 775 28.19 1280 46.56
Once a week 477 17.35 1757 63.91
Several times a week 764 27.79 2521 91.71
Every day 228 8.29 2749 100.00
Frequency Missing = 2
Take part in social activities compared to others of same age
Cumulative Cumulative
SCLACT Frequency Percent Frequency Percent
Much less than most 233 8.57 233 8.57
Less than most 801 29.47 1034 38.04
About the same 1218 44.81 2252 82.86
More than most 418 15.38 2670 98.23
Much more than most 48 1.77 2718 100.00
Frequency Missing = 33
How happy are you
Cumulative Cumulative
HAPPY Frequency Percent Frequency Percent
Extremely unhappy 17 0.62 17 0.62
1 19 0.69 36 1.31
2 35 1.28 71 2.59
3 80 2.92 151 5.51
4 74 2.70 225 8.21
5 315 11.50 540 19.72
6 226 8.25 766 27.97
7 529 19.31 1295 47.28
8 790 28.84 2085 76.12
Frequency Missing = 12
, woensdag 12 december 2018 00:05:32 3
The FREQ Procedure
How happy are you
Cumulative Cumulative
HAPPY Frequency Percent Frequency Percent
9 412 15.04 2497 91.16
Extremely happy 242 8.84 2739 100.00
Frequency Missing = 12
Member of a group discriminated against in this country
Cumulative Cumulative
DSCRGRP Frequency Percent Frequency Percent
Yes 126 4.60 126 4.60
No 2612 95.40 2738 100.00
Frequency Missing = 13
Legal marital status
Cumulative Cumulative
MARITALA Frequency Percent Frequency Percent
Married 1511 55.15 1511 55.15
In a civil partnership 56 2.04 1567 57.19
Separated (still legally married) 41 1.50 1608 58.69
Separated (still in a civil partnership) 1 0.04 1609 58.72
Divorced 232 8.47 1841 67.19
Widowed 194 7.08 2035 74.27
Formerly in civil partnership, now dissolved 4 0.15 2039 74.42
Formerly in civil partnership, partner died 2 0.07 2041 74.49
Never married and never in civil partnership 699 25.51 2740 100.00
Frequency Missing = 11
, woensdag 12 december 2018 00:05:32 4
The FREQ Procedure
Country
Cumulative Cumulative
CNTRY Frequency Percent Frequency Percent
DE 2751 100.00 2751 100.00
Responsible for supervising other employees
Cumulative Cumulative
JBSPV Frequency Percent Frequency Percent
1 872 33.97 872 33.97
2 1695 66.03 2567 100.00
Frequency Missing = 184
Allowed to decide how daily work is organised
Cumulative Cumulative
WKDCORGA Frequency Percent Frequency Percent
0 314 12.28 314 12.28
1 49 1.92 363 14.19
2 109 4.26 472 18.45
3 103 4.03 575 22.48
4 74 2.89 649 25.37
5 231 9.03 880 34.40
6 135 5.28 1015 39.68
7 258 10.09 1273 49.77
8 392 15.32 1665 65.09
9 249 9.73 1914 74.82
10 644 25.18 2558 100.00
Frequency Missing = 193
Allowed to influence policy decisions about activities of
organisation
Cumulative Cumulative
IORGACT Frequency Percent Frequency Percent
0 915 35.85 915 35.85
1 149 5.84 1064 41.69
2 195 7.64 1259 49.33
3 142 5.56 1401 54.90
4 95 3.72 1496 58.62
5 220 8.62 1716 67.24
6 126 4.94 1842 72.18
7 182 7.13 2024 79.31
8 150 5.88 2174 85.19
Frequency Missing = 199