MODULE CODE : MIP2602
UNIQUE CODE : 5695941
ASSIGNMENT NO : 4
DATE : 13-08-2024
, QUESTION 1
1.1. Interpretation of the graph
1.1.1. The number of coins each grade 5 learners has.
1.1.2. Grade 5 learners at immaculate convent school.
1.1.3. 40 Grade 5 learners randomly surveyed
1.1.4. Data collected is quantitative, or numerical as it represents counts of coins. It
is discrete data since the number of coins can only take whole number values.
1.1.5. Bar graph is the best because it shows the frequency distribution of the number
of coins across the learners.
1.2.
1.2.1.1. Pictograph is a graph that represent visual data using picture or symbols to
show the quantity
• Each symbol in a pictograph represents a specific number of items, allowing
for easy comparison of different categories.
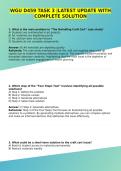
1.2.1.2. Pictogram
Pictograph representing the cellphone sold in
prayash's shop
Yellow Phones
Green Phones
Cellphones
Blue Phones
Red Phones
0 1 2 3 4 5 6 7 8
Number of cellphones
UNIQUE CODE : 5695941
ASSIGNMENT NO : 4
DATE : 13-08-2024
, QUESTION 1
1.1. Interpretation of the graph
1.1.1. The number of coins each grade 5 learners has.
1.1.2. Grade 5 learners at immaculate convent school.
1.1.3. 40 Grade 5 learners randomly surveyed
1.1.4. Data collected is quantitative, or numerical as it represents counts of coins. It
is discrete data since the number of coins can only take whole number values.
1.1.5. Bar graph is the best because it shows the frequency distribution of the number
of coins across the learners.
1.2.
1.2.1.1. Pictograph is a graph that represent visual data using picture or symbols to
show the quantity
• Each symbol in a pictograph represents a specific number of items, allowing
for easy comparison of different categories.
1.2.1.2. Pictogram
Pictograph representing the cellphone sold in
prayash's shop
Yellow Phones
Green Phones
Cellphones
Blue Phones
Red Phones
0 1 2 3 4 5 6 7 8
Number of cellphones