29/03/2024, 23:30 CW2.2 Data Interpretation Quiz: Attempt review | MyQMUL
Started on Friday, 29 March 2024, 10:44 PM
State Finished
Completed on Friday, 29 March 2024, 11:30 PM
Time taken 46 mins 15 secs
Question 1 CompleteNot graded
Which Lab Group were you in?
Select you lab Group from the list: Session 3 (15:30-17:30) Group 3
Session 1 (10:30-12:30) Group 4
Session 1 (10:30-12:30) Group 3
Session 3 (15:30-17:30) Group 1
Session 2 (13:00-15:00) Group 1
Session 2 (13:00-15:00) Group 3
Session 1 (10:30-12:30) Group 1
Session 2 (13:00-15:00) Group 4
Session 1 (10:30-12:30) Group 5
Question 2 CompleteMarked out of 4.00
Session 1 (10:30-12:30) Group 2
Question 1 (a)
Session 3 (15:30-17:30) Group 2
Compare the absorbance data for the protein standards your group prepared and analysed in the laboratory session
(Table 5 of the Data Analysis Worksheet) to the data provided from the 24h experiments
Session 2(Table 2 of the
(13:00-15:00) Data
Group 2 Analysis
Worksheet).
Session 3 (15:30-17:30) Group 4
Explaining your reasoning did you need to repeat the calibration analysis or could you have used the data from the 24h
experiment?
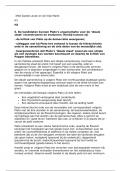
Taking this into account, it can be observed that the average absorbance values for the data collected at 30 minutes are consistently
slightly higher than those recorded after 24 hours, when measured at identical protein concentration standards. However, the
variability of the data, as indicated by the standard deviations, tends to be lower in the 24-hour measurements compared to those
taken at 30 minutes. In light of the information presented in both Table 2 and Table 5, relying solely on one dataset without adequate
replicates lacks validity. Moreover, the extended incubation period likely leads to structural changes in the protein, indicating why the
calibration analysis based on the 30-minute data needed to be repeated to verify the accuracy and reliability of the 24-hour
measurements.
https://qmplus.qmul.ac.uk/mod/quiz/review.php?attempt=3131300&cmid=2206073 1/5
, 29/03/2024, 23:30 CW2.2 Data Interpretation Quiz: Attempt review | MyQMUL
Question 3 CompleteMarked out of 3.00
Question 1 (b)
Considering the data in Table 2, and Table 5, AND the two calibration plots generated from the data your group
collected and the 24 hour incubation data you were provided with.
State which set of calibration data is more reliable?
Give TWO reasons why you have made this decision.
24-hour Calibration data is more reliable because:
1. The lower standard deviations across most of the concentration range in Table 2 suggest that the data points are more consistently
close to each other, which implies that the calibration plot would show a tighter clustering of points around the best-fit line. This
consistency is crucial for making reliable predictions from the calibration curve.
2. The accuracy of the data, as inferred from the small differences in mean absorbance (especially at lower concentrations where
differences become negligible or favour Table 2), suggests that the calibration curve from the 24h incubation data would accurately
reflect the relationship between concentration and absorbance for the samples of interest. This is further reinforced by having a larger
R^2 value of 0.9826 in comparison to 30-minute data which had a value of 0.9675 (R^2 is a model of measure that provides
information about the goodness of a fit of a model. A value of 1 would suggest a perfect prediction and or perfect regression model.)
Question 4 CompleteMarked out of 3.00
Question 1 (c)
Are you confident in using the line of best fit equation obtained by your group to calculate the amount of protein
adsorbed to the test material specimens after 30 minutes?
Explain your reasoning.
I am not confident using the line of best-fit equation obtained by my group because when comparing it to the 24-hour one, it has a
slightly lower R^2 value of 0.9675 in comparison to the 24-hour one which had an R^2 value of 0.9826. My data is 0.0325 away from a
perfect regression line value (this being a value of 1) in comparison to the 24-hour data having a difference from the perfect regression
line of 0.0174. R^2 is a model of measure that provides information about the goodness of a fit of a model. A value of 1 would suggest
a perfect prediction and or perfect regression model. Since the 30-minute data had a lower R^2 value, I am therefore not as confident
Question 5 CompleteMarked out of 4.00
Question 2 (a)
How could you assess the repeatability of each of your group members pipetting skills to determine if this was a
confounding factor to the data you collected?
During the experiment, different sections of the well plate were allocated for pipetting various protein solutions; for instance, HA
solution was prepared by Technician 1 and Al by Technician 2, PLA by Technician 3 and G by Technician 4. By examining the standard
deviations for each row handled by a specific technician, insights can be gained regarding the precision of their pipetting technique.
This analysis hinges on the expectation that the average absorbance values should be roughly consistent. A higher variability in
absorbance readings implies a greater standard deviation, indicating a potential lack of consistency in the pipetted volumes.
Furthermore, if such variability is observed across multiple rows within a technician's section, it might suggest that the inconsistency
is attributable to the type of pipetting tool used, such as a multi-pette versus a micro-pipette.
https://qmplus.qmul.ac.uk/mod/quiz/review.php?attempt=3131300&cmid=2206073 2/5
Started on Friday, 29 March 2024, 10:44 PM
State Finished
Completed on Friday, 29 March 2024, 11:30 PM
Time taken 46 mins 15 secs
Question 1 CompleteNot graded
Which Lab Group were you in?
Select you lab Group from the list: Session 3 (15:30-17:30) Group 3
Session 1 (10:30-12:30) Group 4
Session 1 (10:30-12:30) Group 3
Session 3 (15:30-17:30) Group 1
Session 2 (13:00-15:00) Group 1
Session 2 (13:00-15:00) Group 3
Session 1 (10:30-12:30) Group 1
Session 2 (13:00-15:00) Group 4
Session 1 (10:30-12:30) Group 5
Question 2 CompleteMarked out of 4.00
Session 1 (10:30-12:30) Group 2
Question 1 (a)
Session 3 (15:30-17:30) Group 2
Compare the absorbance data for the protein standards your group prepared and analysed in the laboratory session
(Table 5 of the Data Analysis Worksheet) to the data provided from the 24h experiments
Session 2(Table 2 of the
(13:00-15:00) Data
Group 2 Analysis
Worksheet).
Session 3 (15:30-17:30) Group 4
Explaining your reasoning did you need to repeat the calibration analysis or could you have used the data from the 24h
experiment?
Taking this into account, it can be observed that the average absorbance values for the data collected at 30 minutes are consistently
slightly higher than those recorded after 24 hours, when measured at identical protein concentration standards. However, the
variability of the data, as indicated by the standard deviations, tends to be lower in the 24-hour measurements compared to those
taken at 30 minutes. In light of the information presented in both Table 2 and Table 5, relying solely on one dataset without adequate
replicates lacks validity. Moreover, the extended incubation period likely leads to structural changes in the protein, indicating why the
calibration analysis based on the 30-minute data needed to be repeated to verify the accuracy and reliability of the 24-hour
measurements.
https://qmplus.qmul.ac.uk/mod/quiz/review.php?attempt=3131300&cmid=2206073 1/5
, 29/03/2024, 23:30 CW2.2 Data Interpretation Quiz: Attempt review | MyQMUL
Question 3 CompleteMarked out of 3.00
Question 1 (b)
Considering the data in Table 2, and Table 5, AND the two calibration plots generated from the data your group
collected and the 24 hour incubation data you were provided with.
State which set of calibration data is more reliable?
Give TWO reasons why you have made this decision.
24-hour Calibration data is more reliable because:
1. The lower standard deviations across most of the concentration range in Table 2 suggest that the data points are more consistently
close to each other, which implies that the calibration plot would show a tighter clustering of points around the best-fit line. This
consistency is crucial for making reliable predictions from the calibration curve.
2. The accuracy of the data, as inferred from the small differences in mean absorbance (especially at lower concentrations where
differences become negligible or favour Table 2), suggests that the calibration curve from the 24h incubation data would accurately
reflect the relationship between concentration and absorbance for the samples of interest. This is further reinforced by having a larger
R^2 value of 0.9826 in comparison to 30-minute data which had a value of 0.9675 (R^2 is a model of measure that provides
information about the goodness of a fit of a model. A value of 1 would suggest a perfect prediction and or perfect regression model.)
Question 4 CompleteMarked out of 3.00
Question 1 (c)
Are you confident in using the line of best fit equation obtained by your group to calculate the amount of protein
adsorbed to the test material specimens after 30 minutes?
Explain your reasoning.
I am not confident using the line of best-fit equation obtained by my group because when comparing it to the 24-hour one, it has a
slightly lower R^2 value of 0.9675 in comparison to the 24-hour one which had an R^2 value of 0.9826. My data is 0.0325 away from a
perfect regression line value (this being a value of 1) in comparison to the 24-hour data having a difference from the perfect regression
line of 0.0174. R^2 is a model of measure that provides information about the goodness of a fit of a model. A value of 1 would suggest
a perfect prediction and or perfect regression model. Since the 30-minute data had a lower R^2 value, I am therefore not as confident
Question 5 CompleteMarked out of 4.00
Question 2 (a)
How could you assess the repeatability of each of your group members pipetting skills to determine if this was a
confounding factor to the data you collected?
During the experiment, different sections of the well plate were allocated for pipetting various protein solutions; for instance, HA
solution was prepared by Technician 1 and Al by Technician 2, PLA by Technician 3 and G by Technician 4. By examining the standard
deviations for each row handled by a specific technician, insights can be gained regarding the precision of their pipetting technique.
This analysis hinges on the expectation that the average absorbance values should be roughly consistent. A higher variability in
absorbance readings implies a greater standard deviation, indicating a potential lack of consistency in the pipetted volumes.
Furthermore, if such variability is observed across multiple rows within a technician's section, it might suggest that the inconsistency
is attributable to the type of pipetting tool used, such as a multi-pette versus a micro-pipette.
https://qmplus.qmul.ac.uk/mod/quiz/review.php?attempt=3131300&cmid=2206073 2/5