Statistics Notes
Chapter 1- Introduction to Statistics
Why Study Statistics?
- Stats is required in so many majors
- Numerical information is everywhere (newspapers, news magazines, newsweek,
news and world report…)
- Statistical techniques are used to make decisions that affect the daily lives
(insurance companies use statistical analysis to set rates for home, automobile,
life, and health insurance)
- Knowledge of statistical methods will help to understand how decisions are made
and give a better understanding of how they affect.
- EX. Decisions are based on understanding of data analysis
- In order to make an informed decision, you will need to be able to:
- Determine whether the existing information is adequate or
additional information is required
- Gather additional information, if it is needed
- Summarize the information in a useful and informative manner
- Analyze the available information
- Conclusions and assessing the risk of an incorrect conclusion
Statistics
STATISTICS--- the science of collecting, organizing, presenting, analyzing, and interpreting data
to assist in making more effective decisions
- Stats and problem solving
- Investing a problem is to collect relevant data
- Data organization and presentation in a chart
- After data organization, data analysis and interpretations are possible
Types of Statistics
Descriptive stats
- The definition of stats given earlier referred to “organizing, presenting, analyzing...data.”
This facet of stats is usually referred to as descriptive stats.
- Methods of organizing, summarizing, and presenting data in an informative way.
Inferential stats
- Methods used to estimate a property of a population on the basis of a sample
- Population-- the entire set of individuals or objects of interest or the
measurements obtained from all individuals or objects of interest
- Sample--a portion, or part, of the population of interest
- Why take a sample instead of studying every member of the population?
, - A sample of registered voters is necessary because of the prohibitive cost of
contacting millions of voters before an election. Testing wheat for moisture
content destroys the wheat, thus making a sample imperative
- A random sample of 1,260 marketing graduates from four-year schools showed
their mean starting salary was $42,694. We therefore estimate the mean starting
salary for all marketing graduates of four-year institutions to be $42,694.
Types of Variables
Qualitative (non-numeric)
- When the characteristic being studied is nonnumeric, it is called a qualitative variable or
an attribute
- When the data are qualitative, we are usually interested in how many or what percent fall
in each category.
- Example of qualitative variables are gender, religious affiliation, type of
automobile owned, state of birth, and eye colour
Quantitative (numeric)
- When the variable studied can be reported numerically, the variable is called a
quantitative variable
- Examples of the ages of company presidents, the life of an automobile battery
(such as 42 months), and the number of children in a family
- Quantitative variables are either discrete or continuous:
- Discrete variables can assume only certain values, and there are “gaps” between
the values
- Ex. are the number of bedrooms in a house (1,2,3,4,etc.) and the number
of students in each section of a statistics course.
- Point: notice that a home can have 3 or 4 bedrooms, but it cannot have
3.65 bedrooms. Thus, there is a “gap” between possible values.
- Continuous variables can assume any value within a specific range
- Ex. are the air pressure in a tire, the weight of a shipment of tomatoes
and the amount of raisin bran in a box
Levels of Measurement
There are actually four levels of measurement:nominal, ordinal, interval, and ratio
- Nominal level
- The Lowest, or the most primitive, measurement is the nominal level
- The highest, or the level that gives us the most information about the
observation, is the ratio level of measurement
- Nominal-level data
- For the nominal level of measurement, observations of qualitative variables can
only be classified and counted. There is no particular order to the labels.
, - Ordinal-level data
- Data classifications are represented by sets of labels or names (high, medium,
low) that have relative values
- Interval-level data
- Data classifications are ordered according to the amount of characteristics they
possess
- Equal differences in the characteristic are represented by equal differences in the
measurements
- Point: the interval level of measurement includes all the characteristics of the
ordinal level, but in addition, the difference between values is a constant size
- Ratio-level data
- The ratio level is the “highest” level of measurement. It has all the characteristics
of the interval level, but in addition, the 0 point is meaningful and the ratio
between two numbers is meaningful.
- Data classifications are ordered according to the amount of the
characteristics they possess
- Equal differences in the characteristic are represented by equal
differences in the numbers assigned to the classifications.
- The zero point is the absence of the characteristic and the ratio between
two numbers is meaningful
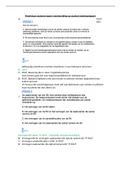
Major Characteristics of Various Levels of Measurement
Nominal Data may only be classified Jersey numbers
Ordinal Data are ranked Rank in a class
Interval Meaningful difference Dress size
between values
Ratio Meaningful 0 point and ration Number of patients seen
between values
Nominal - the data are sorted into categories with no particular order to the categories
Ordinal - presumes that one classification is ranked higher than another
Interval - the ranking characteristic of the ordinal level of measurement plus the characteristic
that the distance between values is a constant size
Ratio - all the characteristics of the interval level, plus there is a 0 point and the ratio of two
values is meaningful
Population vs Sample
Population - the entire set of individuals or objects having some common characteristics
selected for a research study
, Sample - may be defined as representative unit of a target population, which is to be worked
upon by the researchers during their study
SLIDE 26
Chapter 3: Distribution Data Numerically
Describing Data
Central Tendency: It is defined as a single value that is
used to describe the “center” of the data.
- (Arithmetic) mean
- Weighted mean
- Median
- Mode
- Geometric mean
Population Mean
- The sum of all the values in the population divided
by the number of values in the population
- Any measurable characteristic of a population is
called a parameter
- The mean of a population is an example of a parameter
Sample Mean
- The mean is the sum of all the samples values divided by the total number of sampled
values
Chapter 1- Introduction to Statistics
Why Study Statistics?
- Stats is required in so many majors
- Numerical information is everywhere (newspapers, news magazines, newsweek,
news and world report…)
- Statistical techniques are used to make decisions that affect the daily lives
(insurance companies use statistical analysis to set rates for home, automobile,
life, and health insurance)
- Knowledge of statistical methods will help to understand how decisions are made
and give a better understanding of how they affect.
- EX. Decisions are based on understanding of data analysis
- In order to make an informed decision, you will need to be able to:
- Determine whether the existing information is adequate or
additional information is required
- Gather additional information, if it is needed
- Summarize the information in a useful and informative manner
- Analyze the available information
- Conclusions and assessing the risk of an incorrect conclusion
Statistics
STATISTICS--- the science of collecting, organizing, presenting, analyzing, and interpreting data
to assist in making more effective decisions
- Stats and problem solving
- Investing a problem is to collect relevant data
- Data organization and presentation in a chart
- After data organization, data analysis and interpretations are possible
Types of Statistics
Descriptive stats
- The definition of stats given earlier referred to “organizing, presenting, analyzing...data.”
This facet of stats is usually referred to as descriptive stats.
- Methods of organizing, summarizing, and presenting data in an informative way.
Inferential stats
- Methods used to estimate a property of a population on the basis of a sample
- Population-- the entire set of individuals or objects of interest or the
measurements obtained from all individuals or objects of interest
- Sample--a portion, or part, of the population of interest
- Why take a sample instead of studying every member of the population?
, - A sample of registered voters is necessary because of the prohibitive cost of
contacting millions of voters before an election. Testing wheat for moisture
content destroys the wheat, thus making a sample imperative
- A random sample of 1,260 marketing graduates from four-year schools showed
their mean starting salary was $42,694. We therefore estimate the mean starting
salary for all marketing graduates of four-year institutions to be $42,694.
Types of Variables
Qualitative (non-numeric)
- When the characteristic being studied is nonnumeric, it is called a qualitative variable or
an attribute
- When the data are qualitative, we are usually interested in how many or what percent fall
in each category.
- Example of qualitative variables are gender, religious affiliation, type of
automobile owned, state of birth, and eye colour
Quantitative (numeric)
- When the variable studied can be reported numerically, the variable is called a
quantitative variable
- Examples of the ages of company presidents, the life of an automobile battery
(such as 42 months), and the number of children in a family
- Quantitative variables are either discrete or continuous:
- Discrete variables can assume only certain values, and there are “gaps” between
the values
- Ex. are the number of bedrooms in a house (1,2,3,4,etc.) and the number
of students in each section of a statistics course.
- Point: notice that a home can have 3 or 4 bedrooms, but it cannot have
3.65 bedrooms. Thus, there is a “gap” between possible values.
- Continuous variables can assume any value within a specific range
- Ex. are the air pressure in a tire, the weight of a shipment of tomatoes
and the amount of raisin bran in a box
Levels of Measurement
There are actually four levels of measurement:nominal, ordinal, interval, and ratio
- Nominal level
- The Lowest, or the most primitive, measurement is the nominal level
- The highest, or the level that gives us the most information about the
observation, is the ratio level of measurement
- Nominal-level data
- For the nominal level of measurement, observations of qualitative variables can
only be classified and counted. There is no particular order to the labels.
, - Ordinal-level data
- Data classifications are represented by sets of labels or names (high, medium,
low) that have relative values
- Interval-level data
- Data classifications are ordered according to the amount of characteristics they
possess
- Equal differences in the characteristic are represented by equal differences in the
measurements
- Point: the interval level of measurement includes all the characteristics of the
ordinal level, but in addition, the difference between values is a constant size
- Ratio-level data
- The ratio level is the “highest” level of measurement. It has all the characteristics
of the interval level, but in addition, the 0 point is meaningful and the ratio
between two numbers is meaningful.
- Data classifications are ordered according to the amount of the
characteristics they possess
- Equal differences in the characteristic are represented by equal
differences in the numbers assigned to the classifications.
- The zero point is the absence of the characteristic and the ratio between
two numbers is meaningful
Major Characteristics of Various Levels of Measurement
Nominal Data may only be classified Jersey numbers
Ordinal Data are ranked Rank in a class
Interval Meaningful difference Dress size
between values
Ratio Meaningful 0 point and ration Number of patients seen
between values
Nominal - the data are sorted into categories with no particular order to the categories
Ordinal - presumes that one classification is ranked higher than another
Interval - the ranking characteristic of the ordinal level of measurement plus the characteristic
that the distance between values is a constant size
Ratio - all the characteristics of the interval level, plus there is a 0 point and the ratio of two
values is meaningful
Population vs Sample
Population - the entire set of individuals or objects having some common characteristics
selected for a research study
, Sample - may be defined as representative unit of a target population, which is to be worked
upon by the researchers during their study
SLIDE 26
Chapter 3: Distribution Data Numerically
Describing Data
Central Tendency: It is defined as a single value that is
used to describe the “center” of the data.
- (Arithmetic) mean
- Weighted mean
- Median
- Mode
- Geometric mean
Population Mean
- The sum of all the values in the population divided
by the number of values in the population
- Any measurable characteristic of a population is
called a parameter
- The mean of a population is an example of a parameter
Sample Mean
- The mean is the sum of all the samples values divided by the total number of sampled
values