Week 1: 13-17 Feb
Descriptive and exploratory statistics
leaves a tree > e.g. leaf width
POPULATION
, e.g. of
Any of
set
objects, individuals or items with respectto the phenomenon or characteristic thatis
studied, and which forms the whole the objects thatare being studied
or
totality of
>one whole tree
·
defined
by a seto f descriptive conditions
·
has a finite / infinite number of elements
variable:
an observable characteristic a
of
population;e.g. leaf width (random variable X)
be
can
qualitative or
quantative
↓
defined by specifying a
no. of categories:descriptive (observed, notmeasured)
discreet:fixed, isolated values (1, 2, 3, 4 ...)
Quantative
↓
continuous:variable can take on all
possible values within a specific, logical
interval (e.g. age, weight)
amounts thatcan
be counted or measured
measurementof a characteristic
. can be on a nominal, ordinal, interval or ratio scale
-
Nominal:
grouping items into a number categories
of
(only qualitative), e.g. male/female, names,
-
Ordinal: eye colors
ifthe categories can be ordered (e.g. bad, medium, good
-
Interval: e.g. temperature
~>
size the
of difference between any consecutive values (numeric infinitely many values)
e.g. age, temperature, la test
-
RATO?
measurementon the interval scale, butan absolute zero
pointexists
e.g. Kelvin measurements; 100 Kelvin is double so Kelvin;weight, height, distance
, A D
Qualitative Quantative
SAMPLE
subseto felements of the population that is selected to be examined
any
random sample of size ofleaves
e.g.
sampling process -
selecting
of a sample from the population
-
used to make conclusions aboutthe population as a whole
methods
sampling
· random
· stratifiedrandom
·
systematic
· cluster
NOtatiOR
·
population: X random variable
=
leaf-width
-
all
of leaves in particular tree
X -
n(x,08) sample:
E(x) 4
3,5, 3,79...xm 5,53
=
x1 x2
=
= =
var(x) 5 3
0,8 4,07 and
0,72
=
= =
-
,frequency
>
frequency tables 5
A
Discreetn o. of observations
B 3
-
for each value.
for discreetdata: [ 2
grouped frequency table
for continuous data:
Need to items
*
group
into classes
tables for continuous data
frequency
·
Need to
specify intervals for each ofthe classes
range
-
-
no, intervals
-interval widths
-interval limits
-
frequencies
① Range r
largest
=
-
smallestvalue
⑥ No, intervals Typically 6
sturges' rule:1 = 1 +
3.310gion
↑ ↑
no class intervals total no. Observations
③ Interval width preferably equal width
convenient/ sensible
④Internal limits Include all observations
⑥ frequencies No. occurences
of a
of
particular event.
↳
> Interval width
frequencies
-range
no, intervals
12,3] (3,43 (4,5]
(2, 33, interval width is I I 9
(5,6]
10
(3,4],
=>
e.g.
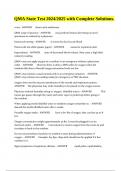
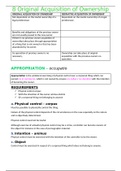
, HISTOGRAM (continuous data)
classification I
grouping
· visual representation
can lead to a loss of
information. (No exact
· area corresponds to
frequency
values of individual items)
· have
equal length intervals
heighta frequencies
->
· bars touch
Frequency distribution: ·
NB:area
corresponds to
frequency crelative
/ data that Area b h frequency)
graph set x
=
shows frequencies then the
equal width,
how ·
If intervals are of
not
are distributed.
the
class
frequencies are not
proportional to
rectangle heights.
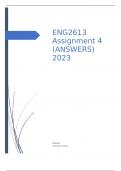
CHART
PIE
· Area & Proportion I percentages HEAT MAP
·
Represented on a 360° ·
color indicates observed values (percentages)
circle divided into sectors ·
proportion a color
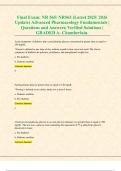
BAR CHARTS <discreetdata)
·
graphical representation discrete
of and
tables
categorical frequency
·
bars are
separate
FREQUENCY POLYGON
·
figure obtained when heights histogram rectangles
of are
plotted against
midpoints class
of intervals
·
an additional interval is added each
at side (same width) with a
frequency of
o to "anchor" the graph
·
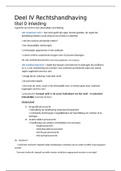
can compare multiple samples STEM AND LEAF DISPLAY
·
similar shape to histogram
CONTINGENCY TABLES ·
Stem:basic interval
·
frequency table for multiple variables ·
leaves:individual observations
2-way tables e.g. 28
-
01076
multiway tables
i
-
00197
·
summaries differenttypes variables
of 15
Stem
fading Dead
Healthy be rounded
· observations can
width < 4 L 0 I
· Stem can be in 19/109/100s etc.
width 4 I 2 2
Descriptive and exploratory statistics
leaves a tree > e.g. leaf width
POPULATION
, e.g. of
Any of
set
objects, individuals or items with respectto the phenomenon or characteristic thatis
studied, and which forms the whole the objects thatare being studied
or
totality of
>one whole tree
·
defined
by a seto f descriptive conditions
·
has a finite / infinite number of elements
variable:
an observable characteristic a
of
population;e.g. leaf width (random variable X)
be
can
qualitative or
quantative
↓
defined by specifying a
no. of categories:descriptive (observed, notmeasured)
discreet:fixed, isolated values (1, 2, 3, 4 ...)
Quantative
↓
continuous:variable can take on all
possible values within a specific, logical
interval (e.g. age, weight)
amounts thatcan
be counted or measured
measurementof a characteristic
. can be on a nominal, ordinal, interval or ratio scale
-
Nominal:
grouping items into a number categories
of
(only qualitative), e.g. male/female, names,
-
Ordinal: eye colors
ifthe categories can be ordered (e.g. bad, medium, good
-
Interval: e.g. temperature
~>
size the
of difference between any consecutive values (numeric infinitely many values)
e.g. age, temperature, la test
-
RATO?
measurementon the interval scale, butan absolute zero
pointexists
e.g. Kelvin measurements; 100 Kelvin is double so Kelvin;weight, height, distance
, A D
Qualitative Quantative
SAMPLE
subseto felements of the population that is selected to be examined
any
random sample of size ofleaves
e.g.
sampling process -
selecting
of a sample from the population
-
used to make conclusions aboutthe population as a whole
methods
sampling
· random
· stratifiedrandom
·
systematic
· cluster
NOtatiOR
·
population: X random variable
=
leaf-width
-
all
of leaves in particular tree
X -
n(x,08) sample:
E(x) 4
3,5, 3,79...xm 5,53
=
x1 x2
=
= =
var(x) 5 3
0,8 4,07 and
0,72
=
= =
-
,frequency
>
frequency tables 5
A
Discreetn o. of observations
B 3
-
for each value.
for discreetdata: [ 2
grouped frequency table
for continuous data:
Need to items
*
group
into classes
tables for continuous data
frequency
·
Need to
specify intervals for each ofthe classes
range
-
-
no, intervals
-interval widths
-interval limits
-
frequencies
① Range r
largest
=
-
smallestvalue
⑥ No, intervals Typically 6
sturges' rule:1 = 1 +
3.310gion
↑ ↑
no class intervals total no. Observations
③ Interval width preferably equal width
convenient/ sensible
④Internal limits Include all observations
⑥ frequencies No. occurences
of a
of
particular event.
↳
> Interval width
frequencies
-range
no, intervals
12,3] (3,43 (4,5]
(2, 33, interval width is I I 9
(5,6]
10
(3,4],
=>
e.g.
, HISTOGRAM (continuous data)
classification I
grouping
· visual representation
can lead to a loss of
information. (No exact
· area corresponds to
frequency
values of individual items)
· have
equal length intervals
heighta frequencies
->
· bars touch
Frequency distribution: ·
NB:area
corresponds to
frequency crelative
/ data that Area b h frequency)
graph set x
=
shows frequencies then the
equal width,
how ·
If intervals are of
not
are distributed.
the
class
frequencies are not
proportional to
rectangle heights.
CHART
PIE
· Area & Proportion I percentages HEAT MAP
·
Represented on a 360° ·
color indicates observed values (percentages)
circle divided into sectors ·
proportion a color
BAR CHARTS <discreetdata)
·
graphical representation discrete
of and
tables
categorical frequency
·
bars are
separate
FREQUENCY POLYGON
·
figure obtained when heights histogram rectangles
of are
plotted against
midpoints class
of intervals
·
an additional interval is added each
at side (same width) with a
frequency of
o to "anchor" the graph
·
can compare multiple samples STEM AND LEAF DISPLAY
·
similar shape to histogram
CONTINGENCY TABLES ·
Stem:basic interval
·
frequency table for multiple variables ·
leaves:individual observations
2-way tables e.g. 28
-
01076
multiway tables
i
-
00197
·
summaries differenttypes variables
of 15
Stem
fading Dead
Healthy be rounded
· observations can
width < 4 L 0 I
· Stem can be in 19/109/100s etc.
width 4 I 2 2