Experimental Research – Stat videos
Inhoud
Week 1 ......................................................................................................................................... 2
Stat Video – Basics of why we test .............................................................................................. 2
Stat video – T-Test (independent samples) .................................................................................. 3
Week 2 ......................................................................................................................................... 5
Stat Video – ANOVA ................................................................................................................... 5
Stat Video - MANOVA (Multiple DV’s) ......................................................................................... 7
Stat Video - Moderation (interaction) in the ANOVA .................................................................... 8
Stat video – Moderation with one categorical and one continuous (scale) variable .......................12
Week 3 ........................................................................................................................................12
On measurement video ............................................................................................................12
Week 4 ........................................................................................................................................14
Stat video – ANCOVA (ANOVA with a covariate) ..........................................................................14
Stat video: Mediation ...............................................................................................................15
Stat video: Dichotomous (binary) DV (in an experiment) .............................................................15
Week 5 ........................................................................................................................................16
,WEEK 1
STAT VIDEO – BASICS OF WHY WE TEST
By just looking at means we can’t be truly sure there is a difference, because there’s variation in
anything. We use statistics to check how likely it is that the difference is there, otherwise we don’t
know if the means differ or if they’re exactly the same.
P-value = the chance you find your data (or a more extreme form), if you assume the null-hypothesis
is true
- If you assume there’s no effect, how likely is it that you find this data?
o Finding a huge difference in your data, makes it very unlikely there’s no effect
▪ If there’s no effect, this data is quite unlikely
- Marginally significant:
o This doesn’t mean there’s a small effect. It’s the chance that’s less likely, but you can
still have a huge effect.
o It doesn’t mean if you had more participants it would’ve been significant. It means
the data is a bit less surprising if you assume the null-hypothesis is true.
If the mean between 2 groups is larger, they’re more likely different, but we also need to know the
amount of variance in a group.
Standard deviation =
- Sum of (Response of a participant – average of a group)2 / (total sample size – 1)
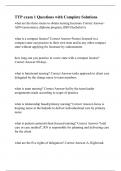
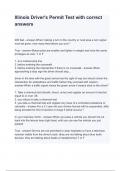
- Example: students 1 – 5 get a grade respectively: 6, 7, 8, 5 and 9 (mean = 7)
o
o If everyone had a 6 or 7, the SD would be smaller
o Somewhat like how much does the average person deviate from the mean of your
group? But it does weigh outliers a little more.
With a normal distribution, most lay around the average, and the further
away, the less likely it is.
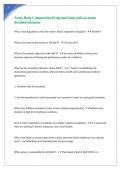
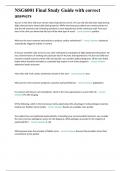
- Classic example: IQ
o It is normed that the average is 100, and the SD is 15
o
- Hypothetical case: people in the US have the average length of world population
o Adding all other countries to the sample will do nothing to the mean, but standard
deviation will increase (shorter and taller people are added)
- If we sampled 100 US males and found the average length and SD
o Adding 100 extra participants will make the mean a more precise estimate of the
true length: the more we sample, the more precise the estimate
o The SD will become more precise (but not necessarily smaller) of the true SD in the
US
, ▪ There’s always a difference, unaffected by sample size, but affected by how
much variation there is in the sample you study.
STAT VIDEO – T-TEST (INDEPENDENT SAMPLES)
With a t-test we check if the means are statistically different. If we observe a difference on a
measure between 2 groups, what makes us more likely to believe that there’s actually a difference?
- A larger difference between the group
- Less variation between individuals in each group
o Group A’s mean is 1.60m, and B’s 1.70m. We’re more sure they’re different if those
in the group are close to the means (1.61m – 1.59m, rather than 1.40m – 1.80m)
- A larger sample size: more observations / participants
o We’re less sure if we only measure 2 people rather than 1000
➔ The last 2 determine the precision of the estimate: make the estimate more precise.
T-test example:
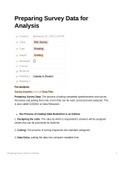
Formula
- Difference in means between 2 conditions, divided by the SD and sample size in each
condition
- We want our t-value as large as possible
o A larger difference between means gives a larger t-value
o A smaller variance gives a larger t-value
o A larger sample size gives a larger t-value
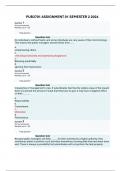
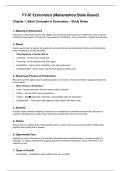
We compare what we found (t-test) to what we’d expect if there’s no actual difference (which we
can simulate – the simulated set):
- Y axis: how often does a certain t-value happen when simulating data without a difference?
- Just because of chance of random sampling, we may accidently find something
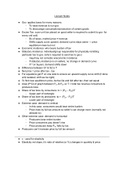
Effect size in t-test: Cohen’s d
- We want to know how much of the variation (= SD) we can explain
o How much can we explain = the difference between means (from our conditions)
- Cohen’s d:
o Difference between means / SD
Inhoud
Week 1 ......................................................................................................................................... 2
Stat Video – Basics of why we test .............................................................................................. 2
Stat video – T-Test (independent samples) .................................................................................. 3
Week 2 ......................................................................................................................................... 5
Stat Video – ANOVA ................................................................................................................... 5
Stat Video - MANOVA (Multiple DV’s) ......................................................................................... 7
Stat Video - Moderation (interaction) in the ANOVA .................................................................... 8
Stat video – Moderation with one categorical and one continuous (scale) variable .......................12
Week 3 ........................................................................................................................................12
On measurement video ............................................................................................................12
Week 4 ........................................................................................................................................14
Stat video – ANCOVA (ANOVA with a covariate) ..........................................................................14
Stat video: Mediation ...............................................................................................................15
Stat video: Dichotomous (binary) DV (in an experiment) .............................................................15
Week 5 ........................................................................................................................................16
,WEEK 1
STAT VIDEO – BASICS OF WHY WE TEST
By just looking at means we can’t be truly sure there is a difference, because there’s variation in
anything. We use statistics to check how likely it is that the difference is there, otherwise we don’t
know if the means differ or if they’re exactly the same.
P-value = the chance you find your data (or a more extreme form), if you assume the null-hypothesis
is true
- If you assume there’s no effect, how likely is it that you find this data?
o Finding a huge difference in your data, makes it very unlikely there’s no effect
▪ If there’s no effect, this data is quite unlikely
- Marginally significant:
o This doesn’t mean there’s a small effect. It’s the chance that’s less likely, but you can
still have a huge effect.
o It doesn’t mean if you had more participants it would’ve been significant. It means
the data is a bit less surprising if you assume the null-hypothesis is true.
If the mean between 2 groups is larger, they’re more likely different, but we also need to know the
amount of variance in a group.
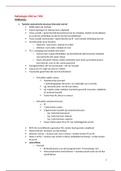
Standard deviation =
- Sum of (Response of a participant – average of a group)2 / (total sample size – 1)
- Example: students 1 – 5 get a grade respectively: 6, 7, 8, 5 and 9 (mean = 7)
o
o If everyone had a 6 or 7, the SD would be smaller
o Somewhat like how much does the average person deviate from the mean of your
group? But it does weigh outliers a little more.
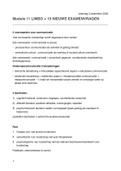
With a normal distribution, most lay around the average, and the further
away, the less likely it is.
- Classic example: IQ
o It is normed that the average is 100, and the SD is 15
o
- Hypothetical case: people in the US have the average length of world population
o Adding all other countries to the sample will do nothing to the mean, but standard
deviation will increase (shorter and taller people are added)
- If we sampled 100 US males and found the average length and SD
o Adding 100 extra participants will make the mean a more precise estimate of the
true length: the more we sample, the more precise the estimate
o The SD will become more precise (but not necessarily smaller) of the true SD in the
US
, ▪ There’s always a difference, unaffected by sample size, but affected by how
much variation there is in the sample you study.
STAT VIDEO – T-TEST (INDEPENDENT SAMPLES)
With a t-test we check if the means are statistically different. If we observe a difference on a
measure between 2 groups, what makes us more likely to believe that there’s actually a difference?
- A larger difference between the group
- Less variation between individuals in each group
o Group A’s mean is 1.60m, and B’s 1.70m. We’re more sure they’re different if those
in the group are close to the means (1.61m – 1.59m, rather than 1.40m – 1.80m)
- A larger sample size: more observations / participants
o We’re less sure if we only measure 2 people rather than 1000
➔ The last 2 determine the precision of the estimate: make the estimate more precise.
T-test example:
Formula
- Difference in means between 2 conditions, divided by the SD and sample size in each
condition
- We want our t-value as large as possible
o A larger difference between means gives a larger t-value
o A smaller variance gives a larger t-value
o A larger sample size gives a larger t-value
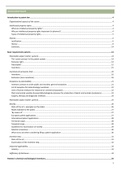
We compare what we found (t-test) to what we’d expect if there’s no actual difference (which we
can simulate – the simulated set):
- Y axis: how often does a certain t-value happen when simulating data without a difference?
- Just because of chance of random sampling, we may accidently find something
Effect size in t-test: Cohen’s d
- We want to know how much of the variation (= SD) we can explain
o How much can we explain = the difference between means (from our conditions)
- Cohen’s d:
o Difference between means / SD