Advanced Quantitative Techniques
MODULE 1 (micro, macro, meso)
Class 1- Introduction
Multivariate: different techniques in different levels
Module 2- Multilevel modelling
Class 1- introduction
1- aims
Importance of multilevel modelling for sociology
• Compatibility between theoretical/conceptual and empirical model:
o In many cases mix of concepts at different levels of abstraction / aggregation
o Our theoretical models include more than one level of aggregation (e.g. individual characteristics, social
level, macro level,micro, meso…) →we need methodological tools that can do this
▪ Macro level that influence individual’s characteristics or vice versa
• Illustrations:
o partner selection in ethnic minorities: individual characteristics and structural elements in marriage
market
o academic achievement or wellbeing of pupils: pupil and school characteristics
o mental health: individual and country characteristics
• Basic multilevel model:
o allows to simultaneously quantify different levels of aggregation (micro, macro, meso) in a single
statistical model
o via:
1. decomposition of unexplained (residual) variance
= refers to the variance in a model that cannot be explained by the variables in the model.
= variance: differences between people (eg mean of school A and B) and between schools
o in statistics, we are not interested in individual processes but general pop (samples)
o at all levels we assume that we have a random sample + that we have variance
2. explain unexplained variance at respective levels of analysis
a. we explain differences within the total population/sample
i. we first asses the differences and then we try to understand by introducing variables at different
levels
o with as an essential element: units at all levels are (simple) random sample from population distributions
▪ all bcs of variances, the first condition is that we need variance (eg not just 4 students to
research well-being of students)
1
, ➔sufficient number of units at all levels is a necessary condition to draw reliable conclusions
➔rule of thumb: absolute minimum of 25 higher level units, but even better to have 100+ higher level units,
and 20+ level 1 units per level 2 unit (25 pupils in 25 schools) →the more the better
• If you want to do multi-level analysis, you already need to do it in the data collection (better 50 schools and for
each school 100 pupils to have variance at the school instead of 10 schools with 1000 students) →obtaining
variance at all levels – importance to have a lot of higher level numbers too
• We don’t always work with samples (eg research with EU member states: no random samples)
o Country levels shouldn’t be applied in a multilevel analysis
• consequence: dealing with clustering of lower level units in higher level units: solution for auto-correlation
clustered data: Clustered data arise when the data from the whole study can be classified into a number of
different groups (eg pupils in schools), referred to as clusters – you come to the wrong conclusion
o multilevel modelling can also be used to simply account for auto-correlation, apart from
theoretical/conceptual considerations (eg. interviewer effects, ...)
o if you have clustered data then there is a problem but multilevel method can be used as it
accommodates for that as then you get more reliable results (compared to OLS)
• and extension to other ‘nested’ data structures is straightforward (‘nested’ = lower level units are nested
(embedded) in higher level units)
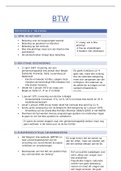
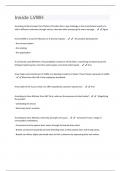
2- multilevel data structures
the squared are pupils
the most simple model of multilevel data: the level 1 is only in one group
the type of data that we will limit ourselves too
each level 1 is nested in level 2
Can be more complex: pupils within classes, within schools
We can include the levels but in real world it’s more 3 levels
!! be aware that on each level, we have the level of aggregation →sample of
cases from a larger population
o At the higher level you don’t only include a higher level but a variable
→Level 1: pupils, level 2: schools, level 3: private or public schools
→BUT the private or public schools is a variable (characteristic of a school), not a level!
o Level: sample of cases from a population
2
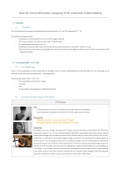
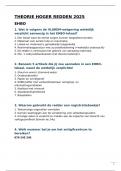
,a 2-level study for examining school effects on pupil exam score
• dependent/response variable is the pupil exam score in the London area, where
students had to a standardized exam
eg first pupil has 75
• subscript: ppl exam scores i, j (i= individual + context =j, second level)
• important to sort your data!
o The rows are the individual levels and also here the school type (column)
is at the individual level (the score/school variable for each pupil)
Variance of diff in scores explained by results on difference on previous exam scores,
effect of gender and school type = independent variables
Some multilevel questions
• What is the between-school variation in exam score?
• Are schools more variable in their exam scores for pupils with low prior attainment?
• Does the gender gap vary across schools?
• Do pupils score higher in private than public schools?
• Do girls score higher in private schools?
A) Hierarchical model: remarks
• Straightforward extension to more levels
• Data does not need to be ‘balanced’ (not necessary to have the same number of units at all levels)
o 50 schools and 100students, in a balanced school you have the number of students in the same schools
o In the old days this was a necessity but nowadays it’s not necessary anymore (not really important to know)
• Data with a small number of level 1 units per level 2 unit can be analysed (eg. individuals in households)
o At each level with have a sample of cases from population of cases, then in multilevel we can suffice with a
low level of 1 units per level 2 unit = eg data set with 20.000 level 2 unit and 40.000 level 1 unit
• When variation at level 2 is crucial: important to select a high number of level 2 units, even if this implies a lower
number of level 1 units
o We need a lot of level 1 units within a limited units in level 2 BUT you can also have a dataset with 20000
level 2 units and only 40000level 1 units
o It’s all about variances and you need variances on all levels
• Course here: limited to basic model of data structure, but more complex designs are possible
B) Other data-set structures for which multilevel data is used
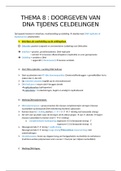
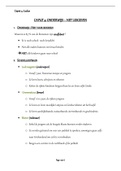
➢ Extension general multilevel model: repeated measurement design
• When you follow people in time – longitudinal
advantage: not necessary to have information for all individuals at all points in time
o at second level we have individuals and at level 1 we have a measurement at
a specific time (level one is the bottom)
3
, o eg longitudinal data on health: we go to the same ppl and ask them about their health →health variances
within individuals and between time period (follow people in time to eg see the long term effect of smoking)
▪ causal inferences that you can’t do in cross-sectional analysis
o not necessary to have full information because you assume that you have a random sample of individuals
and of time moments (so you don’t need to have equal amounts of info)
o t1,t2,… are the time moments - but you can include any characteristics you want to see at level 1
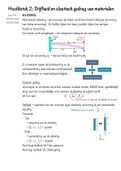
• meta-analysis
=several surveys on the same topic but using the same questionnaire and aggregate all
the data in a meta-analysis
• include all of the individuals in one big data set
• include variable both at individual or study level (eg which country? ..) →are there
any research characteristic that can explain differences
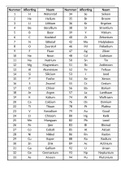
• multiple membership
• a level 1 unit can be nested in different level 2 units (not hierarchical)
• more common: not hierarchical bcs not each level 1 is included in 1 and only 1
higher level unit
o eg if you do research in school, pupils move schools so part of the info applies to
school 1 and can also apply to school 2
o eg an individual can live in gent but work in brussels
• cross-classified design
• a level 1 unit can be nested in different type of level 2 units
• the 2 formers can be combines:
o ppl within schools, living in specific areas where
students live if you want to do research of criminal
behaviour both where you go to school and where you
live can have an effect
3- Errors when ignoring a multilevel structure
A) Multilevel theory without multilevel analysis- consequences of suboptimal modelling
• When multilevel structure in data is ignored
➔ errors in analyses and conclusions
• (wrong) strategy 1:
o single level analysis at level 1 (students)
▪ problem bcs you come to the wrong conclusions – like students are randomly sampled
o + include level 2 explanatory variables at level 1
(as if measured at level 1- you just do an OLS)
▪ You include school characteristics as if they were individual characteristics
o problem of autocorrelation
▪ pupils are clustered within schools so you know that pupils from the same school will be more
similar than pupils coming from different schools
4
MODULE 1 (micro, macro, meso)
Class 1- Introduction
Multivariate: different techniques in different levels
Module 2- Multilevel modelling
Class 1- introduction
1- aims
Importance of multilevel modelling for sociology
• Compatibility between theoretical/conceptual and empirical model:
o In many cases mix of concepts at different levels of abstraction / aggregation
o Our theoretical models include more than one level of aggregation (e.g. individual characteristics, social
level, macro level,micro, meso…) →we need methodological tools that can do this
▪ Macro level that influence individual’s characteristics or vice versa
• Illustrations:
o partner selection in ethnic minorities: individual characteristics and structural elements in marriage
market
o academic achievement or wellbeing of pupils: pupil and school characteristics
o mental health: individual and country characteristics
• Basic multilevel model:
o allows to simultaneously quantify different levels of aggregation (micro, macro, meso) in a single
statistical model
o via:
1. decomposition of unexplained (residual) variance
= refers to the variance in a model that cannot be explained by the variables in the model.
= variance: differences between people (eg mean of school A and B) and between schools
o in statistics, we are not interested in individual processes but general pop (samples)
o at all levels we assume that we have a random sample + that we have variance
2. explain unexplained variance at respective levels of analysis
a. we explain differences within the total population/sample
i. we first asses the differences and then we try to understand by introducing variables at different
levels
o with as an essential element: units at all levels are (simple) random sample from population distributions
▪ all bcs of variances, the first condition is that we need variance (eg not just 4 students to
research well-being of students)
1
, ➔sufficient number of units at all levels is a necessary condition to draw reliable conclusions
➔rule of thumb: absolute minimum of 25 higher level units, but even better to have 100+ higher level units,
and 20+ level 1 units per level 2 unit (25 pupils in 25 schools) →the more the better
• If you want to do multi-level analysis, you already need to do it in the data collection (better 50 schools and for
each school 100 pupils to have variance at the school instead of 10 schools with 1000 students) →obtaining
variance at all levels – importance to have a lot of higher level numbers too
• We don’t always work with samples (eg research with EU member states: no random samples)
o Country levels shouldn’t be applied in a multilevel analysis
• consequence: dealing with clustering of lower level units in higher level units: solution for auto-correlation
clustered data: Clustered data arise when the data from the whole study can be classified into a number of
different groups (eg pupils in schools), referred to as clusters – you come to the wrong conclusion
o multilevel modelling can also be used to simply account for auto-correlation, apart from
theoretical/conceptual considerations (eg. interviewer effects, ...)
o if you have clustered data then there is a problem but multilevel method can be used as it
accommodates for that as then you get more reliable results (compared to OLS)
• and extension to other ‘nested’ data structures is straightforward (‘nested’ = lower level units are nested
(embedded) in higher level units)
2- multilevel data structures
the squared are pupils
the most simple model of multilevel data: the level 1 is only in one group
the type of data that we will limit ourselves too
each level 1 is nested in level 2
Can be more complex: pupils within classes, within schools
We can include the levels but in real world it’s more 3 levels
!! be aware that on each level, we have the level of aggregation →sample of
cases from a larger population
o At the higher level you don’t only include a higher level but a variable
→Level 1: pupils, level 2: schools, level 3: private or public schools
→BUT the private or public schools is a variable (characteristic of a school), not a level!
o Level: sample of cases from a population
2
,a 2-level study for examining school effects on pupil exam score
• dependent/response variable is the pupil exam score in the London area, where
students had to a standardized exam
eg first pupil has 75
• subscript: ppl exam scores i, j (i= individual + context =j, second level)
• important to sort your data!
o The rows are the individual levels and also here the school type (column)
is at the individual level (the score/school variable for each pupil)
Variance of diff in scores explained by results on difference on previous exam scores,
effect of gender and school type = independent variables
Some multilevel questions
• What is the between-school variation in exam score?
• Are schools more variable in their exam scores for pupils with low prior attainment?
• Does the gender gap vary across schools?
• Do pupils score higher in private than public schools?
• Do girls score higher in private schools?
A) Hierarchical model: remarks
• Straightforward extension to more levels
• Data does not need to be ‘balanced’ (not necessary to have the same number of units at all levels)
o 50 schools and 100students, in a balanced school you have the number of students in the same schools
o In the old days this was a necessity but nowadays it’s not necessary anymore (not really important to know)
• Data with a small number of level 1 units per level 2 unit can be analysed (eg. individuals in households)
o At each level with have a sample of cases from population of cases, then in multilevel we can suffice with a
low level of 1 units per level 2 unit = eg data set with 20.000 level 2 unit and 40.000 level 1 unit
• When variation at level 2 is crucial: important to select a high number of level 2 units, even if this implies a lower
number of level 1 units
o We need a lot of level 1 units within a limited units in level 2 BUT you can also have a dataset with 20000
level 2 units and only 40000level 1 units
o It’s all about variances and you need variances on all levels
• Course here: limited to basic model of data structure, but more complex designs are possible
B) Other data-set structures for which multilevel data is used
➢ Extension general multilevel model: repeated measurement design
• When you follow people in time – longitudinal
advantage: not necessary to have information for all individuals at all points in time
o at second level we have individuals and at level 1 we have a measurement at
a specific time (level one is the bottom)
3
, o eg longitudinal data on health: we go to the same ppl and ask them about their health →health variances
within individuals and between time period (follow people in time to eg see the long term effect of smoking)
▪ causal inferences that you can’t do in cross-sectional analysis
o not necessary to have full information because you assume that you have a random sample of individuals
and of time moments (so you don’t need to have equal amounts of info)
o t1,t2,… are the time moments - but you can include any characteristics you want to see at level 1
• meta-analysis
=several surveys on the same topic but using the same questionnaire and aggregate all
the data in a meta-analysis
• include all of the individuals in one big data set
• include variable both at individual or study level (eg which country? ..) →are there
any research characteristic that can explain differences
• multiple membership
• a level 1 unit can be nested in different level 2 units (not hierarchical)
• more common: not hierarchical bcs not each level 1 is included in 1 and only 1
higher level unit
o eg if you do research in school, pupils move schools so part of the info applies to
school 1 and can also apply to school 2
o eg an individual can live in gent but work in brussels
• cross-classified design
• a level 1 unit can be nested in different type of level 2 units
• the 2 formers can be combines:
o ppl within schools, living in specific areas where
students live if you want to do research of criminal
behaviour both where you go to school and where you
live can have an effect
3- Errors when ignoring a multilevel structure
A) Multilevel theory without multilevel analysis- consequences of suboptimal modelling
• When multilevel structure in data is ignored
➔ errors in analyses and conclusions
• (wrong) strategy 1:
o single level analysis at level 1 (students)
▪ problem bcs you come to the wrong conclusions – like students are randomly sampled
o + include level 2 explanatory variables at level 1
(as if measured at level 1- you just do an OLS)
▪ You include school characteristics as if they were individual characteristics
o problem of autocorrelation
▪ pupils are clustered within schools so you know that pupils from the same school will be more
similar than pupils coming from different schools
4