Statistics 3
TENTAMEN/EXAM: 27 March 2020
INDEX
1. Basics and Linear regression 2
2. Variance analysis 6
3. Factorial ANOVA 9
4. Covariance analysis 13
5. Moderation and mediation 16
6. Multivariate analyses 19
7. Repeated measures 22
8. Overview table (F)AN(C)OVA 24
This summary includes (almost) everything from the lectures and the chapters from the book.
DISCLAIMER
This summary is made by a student!
Studying from it and relying on it for 100% is your own responsibility.
THANKS & GOOD LUCK!!! J
J YOU CAN DO IT!!! CA
, 2
Basics and linear regression
Warner Ch. 9
*Note. Not everything from Stats 1 and 2 is explained extensively in this recap part, since it is considered
background knowledge.
Recap Stats 1 and 2
- Statistics – the science of collecting, organizing and interpreting numerical facts (data)
o Descriptive statistics – summarizing sample or population data with numbers/tables/graphs
o Inferential statistics – making predictions about population parameters based on a (random)
sample of data
- Population – total set of participants relevant for the research question (population parameter)
- Sample – subset of population about who the data is collected (sample statistic)
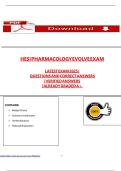
- Reliability and validity
o Reliability = precision
o Validity = bias
§ 2nd one is valid (unbiased), because on average you
will still get the correct value
o Reliability and validity are essentially not linked to each
other or intertwined, but they are independent concepts
Descriptive statistics
- Variable – measures characteristics that can differ between subjects
o Measuring scales (NOIR)
§ Qualitative/categorical
• Nominal – unordered categories
• Ordinal – ordered categories
§ Quantitative/numerical
• Interval – equal distances between consecutive values
• Ratio – equal distances and true 0
§ Many researchers use Likert scales and transfer them from ordinal à interval by assigning
numbers to the categories… allowed?
o Range
§ Discrete – measurement unit that is indivisible
§ Continuous – infinitely dividable measurement unit
§ Rule of thumb = that when a discrete measure has 7 or more units, it can be considered as
continuous
- 3 important dimensions of descriptives
o Central tendency – typical observation (mean, mode (most frequent), median (middle observation)
§ Also: mean is not always the best measure (e.g. if distribution is skewed)
o Dispersion – gives info about the extent to which a distribution is stretched or squeezed (standard
deviation, variance, interquartile range)
o Relative position measures – gives info about the relative position of observations (percentile,
quartile)
Inferential statistics
- We want to have reliable and valid statements about the population based on sample: sample statistic
(in ideal world) should not differ from population parameter
o Problems with this:
§ Sampling error random sample differences
, 3
§ Sampling bias bias due to selective sample
§ Response bias bias due to incorrect answer
§ Non-response bias bias due to non-response (missings)
o You want to avoid bias by all means. You cannot actively avoid error. We can minimize error by
having a large sample (N). N does not influence bias!
o Solution = A random (or other probability) sampling approach of sufficient size that generates data
for everyone approached, with correct responses on all items for all subjects.
- 3 distributions
o Population distribution – how is the variable actually distributed in the population
o Sample data distribution – how is the data distributed in the sample we drew
o Sampling distribution – the probability for the sample statistic, e.g. the mean
§ The mean of this distribution is then the mean of all the sample means. = best estimation of
population parameter
§ Shows us how the statistic behaves from sample to sample
§ Standard deviation of this distribution = standard error
• Less variability in the sampling distribution than in the population distribution
• Less variability in the sampling distribution
when you draw bigger samples
- Central Limit Theorem: no matter the population
distribution, if you have a large enough sample size, the
sampling distribution will be normally distributed
o This is a necessary assumption for e.g. calculating CI
and p-values
o Empirical rule for normal distribution
o 68% within ± 1 𝜎 of the mean
o 95% within ± 2 𝜎 of the mean
o Almost 100% within ± 3 𝜎 of the mean
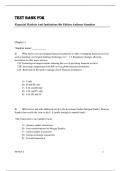
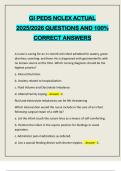
- Types of distributions
o (Standard-) normal distribution (Z-distribution)
§ Sampling distribution of a proportion if H0 applies
§ Sampling distribution of a mean if H0 applies and if
the population sd is known
§ In figure: the black distribution is the standard normal
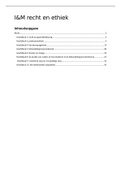
o Student’s t-distribution
§ Sampling distribution of a mean if H0 applies and if
the population sd is unknown (which is basically
always)
§ Sampling distribution of a regression coefficient if H0
applies
§ In figure: you can see the different t-distributions for different sample sizes (n’s)
• Here you see, as the sample size increases, the t-distribution starts to resemble the z-
distribution more and more
• Can also see this in the t-table: last row in t-table (df = infinite), you see that these numbers
are the same as the ones in the z-table
§ In the T-distribution, we assume we do not know the standard deviation à we estimate it using
sample standard deviation
• Extra estimate of s à more uncertainty à more difficult to reject H0 à use df = n-1
• DF refers to the number of observations that are free to vary. You lose 1 df for each sample
statistic you incorporate.
TENTAMEN/EXAM: 27 March 2020
INDEX
1. Basics and Linear regression 2
2. Variance analysis 6
3. Factorial ANOVA 9
4. Covariance analysis 13
5. Moderation and mediation 16
6. Multivariate analyses 19
7. Repeated measures 22
8. Overview table (F)AN(C)OVA 24
This summary includes (almost) everything from the lectures and the chapters from the book.
DISCLAIMER
This summary is made by a student!
Studying from it and relying on it for 100% is your own responsibility.
THANKS & GOOD LUCK!!! J
J YOU CAN DO IT!!! CA
, 2
Basics and linear regression
Warner Ch. 9
*Note. Not everything from Stats 1 and 2 is explained extensively in this recap part, since it is considered
background knowledge.
Recap Stats 1 and 2
- Statistics – the science of collecting, organizing and interpreting numerical facts (data)
o Descriptive statistics – summarizing sample or population data with numbers/tables/graphs
o Inferential statistics – making predictions about population parameters based on a (random)
sample of data
- Population – total set of participants relevant for the research question (population parameter)
- Sample – subset of population about who the data is collected (sample statistic)
- Reliability and validity
o Reliability = precision
o Validity = bias
§ 2nd one is valid (unbiased), because on average you
will still get the correct value
o Reliability and validity are essentially not linked to each
other or intertwined, but they are independent concepts
Descriptive statistics
- Variable – measures characteristics that can differ between subjects
o Measuring scales (NOIR)
§ Qualitative/categorical
• Nominal – unordered categories
• Ordinal – ordered categories
§ Quantitative/numerical
• Interval – equal distances between consecutive values
• Ratio – equal distances and true 0
§ Many researchers use Likert scales and transfer them from ordinal à interval by assigning
numbers to the categories… allowed?
o Range
§ Discrete – measurement unit that is indivisible
§ Continuous – infinitely dividable measurement unit
§ Rule of thumb = that when a discrete measure has 7 or more units, it can be considered as
continuous
- 3 important dimensions of descriptives
o Central tendency – typical observation (mean, mode (most frequent), median (middle observation)
§ Also: mean is not always the best measure (e.g. if distribution is skewed)
o Dispersion – gives info about the extent to which a distribution is stretched or squeezed (standard
deviation, variance, interquartile range)
o Relative position measures – gives info about the relative position of observations (percentile,
quartile)
Inferential statistics
- We want to have reliable and valid statements about the population based on sample: sample statistic
(in ideal world) should not differ from population parameter
o Problems with this:
§ Sampling error random sample differences
, 3
§ Sampling bias bias due to selective sample
§ Response bias bias due to incorrect answer
§ Non-response bias bias due to non-response (missings)
o You want to avoid bias by all means. You cannot actively avoid error. We can minimize error by
having a large sample (N). N does not influence bias!
o Solution = A random (or other probability) sampling approach of sufficient size that generates data
for everyone approached, with correct responses on all items for all subjects.
- 3 distributions
o Population distribution – how is the variable actually distributed in the population
o Sample data distribution – how is the data distributed in the sample we drew
o Sampling distribution – the probability for the sample statistic, e.g. the mean
§ The mean of this distribution is then the mean of all the sample means. = best estimation of
population parameter
§ Shows us how the statistic behaves from sample to sample
§ Standard deviation of this distribution = standard error
• Less variability in the sampling distribution than in the population distribution
• Less variability in the sampling distribution
when you draw bigger samples
- Central Limit Theorem: no matter the population
distribution, if you have a large enough sample size, the
sampling distribution will be normally distributed
o This is a necessary assumption for e.g. calculating CI
and p-values
o Empirical rule for normal distribution
o 68% within ± 1 𝜎 of the mean
o 95% within ± 2 𝜎 of the mean
o Almost 100% within ± 3 𝜎 of the mean
- Types of distributions
o (Standard-) normal distribution (Z-distribution)
§ Sampling distribution of a proportion if H0 applies
§ Sampling distribution of a mean if H0 applies and if
the population sd is known
§ In figure: the black distribution is the standard normal
o Student’s t-distribution
§ Sampling distribution of a mean if H0 applies and if
the population sd is unknown (which is basically
always)
§ Sampling distribution of a regression coefficient if H0
applies
§ In figure: you can see the different t-distributions for different sample sizes (n’s)
• Here you see, as the sample size increases, the t-distribution starts to resemble the z-
distribution more and more
• Can also see this in the t-table: last row in t-table (df = infinite), you see that these numbers
are the same as the ones in the z-table
§ In the T-distribution, we assume we do not know the standard deviation à we estimate it using
sample standard deviation
• Extra estimate of s à more uncertainty à more difficult to reject H0 à use df = n-1
• DF refers to the number of observations that are free to vary. You lose 1 df for each sample
statistic you incorporate.