Quantitative Methods
1a – Introduction
Learning goals:
- Knowledge of the most important concepts and techniques (inductive; estimation and testing) to
analyse coherence, correlation and causal relationships in Geography, Planning and
Environmental Sciences
- Skills to apply these techniques
- Ability to assess the outcomes and the quality of these techniques
Structure and organisation
Five theme blocks
- Correlation and Regression (Pascal Beckers)
- Discrete Choice Modelling (Pascal Beckers)
- Structural Equation Modelling (Martin van der Velde)
- Spatial Analysis (Martin van der Velde)
- Time Series Analysis (Pascal Beckers)
There will be two types of sessions:
- Plenary sessions (Monday and Tuesday)
- Practical sessions in the computer lab to apply the techniques (Monday and Friday)
Sometimes there be also a live meeting, discussion about an article or a Q&A
For the literature you need to use two books, a reader and online articles.
Grading;
- Portfolio of weekly assignements – with a group (23 oktober)
- Written exam with open questions and closed book (3 november) → about the knowledge
- Final integrative assignment – with a group (4 december)
- Resit exam / Herkansing (23 januari)
For the practical sessions we use the software SPSS, AMOS and Excel (or a comparable spreadsheet-
package like google sheets).
We use the software in the practical sessions on the computers in the computer-lab.
SPSS can be purchased; AMOS is unfortunately only available on-campus.
1b Data collection, variable types and methods of analysis, OLS
(conditions, pragmatism and justification)
(Links in slides → even naar kijken)
(1) General considerations of quantitative methods
Link 1: https://www.youtube.com/watch?v=gctAuZGrdbQ
Inductive and deductive research??
Deductieve → kwalitatief onderzoek // theorieën, methodes enz.
Inductive → kwantitatief onderzoek // nieuwe methodes bekijken of bedenken
Link 2: https://www.youtube.com/watch?v=hOMBe8ykpwM&feature=youtu.be
Link 3: https://www.youtube.com/watch?v=1CeXcebWq1w&feature=youtu.be
,Reliability laten zien dus bijvoorbeeld mensen vullen de enquête in als goedaardigheid
Variable types and methods of analysis:
1. Response variable (dependent variable) vs. explanatory variable (independent variable)
Dependent variable; ??
Independent variable; Concept that you are using to explain the concept
2. Manifest vs. latent variable
Manifest variable; concept ,that is measurable, which is analysis.
Latent variable; (globalizing – international migration)
Be specific in the data; income is a really big meaning. Show in the data that it contains income from
labor.
Link 4: https://www.youtube.com/watch?v=hZxnzfnt5v8
Level of measurement;
- Nominal; the values are equal like the term colour
- Ordinal; the values are not equal like the term ??
- Interval/Ratio; it is like the mean, medium etc.
It is important to know which variable you need to take and combine a level of measurement.
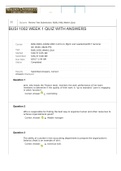
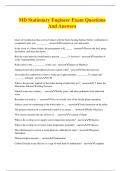
Types of variables and methods of analysis
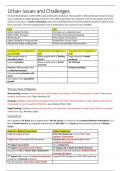
(2) Recap lineair regression analysis (if dependent variable is metric)
Example dataset;
Independent variable is size and age
,i = observations
Bijvoorbeeld : X1 = size - X2 = age
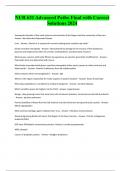
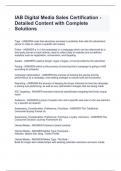
Linear Regression
, Residual = the difference between the observed and the predicted value
How do you know that the linear line is a good fit? R-square helps with that
The R-spuare always had two questions; Can we use a model? How good does the model fit?
The institution of the formula is important for the test.
A-square is a figure between 0 and 1
Ei = R??
The line needs to be close to the dots.
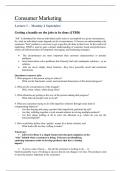
Check model assumptions:
You need to check model assumptions. After that you can draw conclusions.
1. The sample consists of independent observations
The indicators need to be independent; age and size is independent.
1a – Introduction
Learning goals:
- Knowledge of the most important concepts and techniques (inductive; estimation and testing) to
analyse coherence, correlation and causal relationships in Geography, Planning and
Environmental Sciences
- Skills to apply these techniques
- Ability to assess the outcomes and the quality of these techniques
Structure and organisation
Five theme blocks
- Correlation and Regression (Pascal Beckers)
- Discrete Choice Modelling (Pascal Beckers)
- Structural Equation Modelling (Martin van der Velde)
- Spatial Analysis (Martin van der Velde)
- Time Series Analysis (Pascal Beckers)
There will be two types of sessions:
- Plenary sessions (Monday and Tuesday)
- Practical sessions in the computer lab to apply the techniques (Monday and Friday)
Sometimes there be also a live meeting, discussion about an article or a Q&A
For the literature you need to use two books, a reader and online articles.
Grading;
- Portfolio of weekly assignements – with a group (23 oktober)
- Written exam with open questions and closed book (3 november) → about the knowledge
- Final integrative assignment – with a group (4 december)
- Resit exam / Herkansing (23 januari)
For the practical sessions we use the software SPSS, AMOS and Excel (or a comparable spreadsheet-
package like google sheets).
We use the software in the practical sessions on the computers in the computer-lab.
SPSS can be purchased; AMOS is unfortunately only available on-campus.
1b Data collection, variable types and methods of analysis, OLS
(conditions, pragmatism and justification)
(Links in slides → even naar kijken)
(1) General considerations of quantitative methods
Link 1: https://www.youtube.com/watch?v=gctAuZGrdbQ
Inductive and deductive research??
Deductieve → kwalitatief onderzoek // theorieën, methodes enz.
Inductive → kwantitatief onderzoek // nieuwe methodes bekijken of bedenken
Link 2: https://www.youtube.com/watch?v=hOMBe8ykpwM&feature=youtu.be
Link 3: https://www.youtube.com/watch?v=1CeXcebWq1w&feature=youtu.be
,Reliability laten zien dus bijvoorbeeld mensen vullen de enquête in als goedaardigheid
Variable types and methods of analysis:
1. Response variable (dependent variable) vs. explanatory variable (independent variable)
Dependent variable; ??
Independent variable; Concept that you are using to explain the concept
2. Manifest vs. latent variable
Manifest variable; concept ,that is measurable, which is analysis.
Latent variable; (globalizing – international migration)
Be specific in the data; income is a really big meaning. Show in the data that it contains income from
labor.
Link 4: https://www.youtube.com/watch?v=hZxnzfnt5v8
Level of measurement;
- Nominal; the values are equal like the term colour
- Ordinal; the values are not equal like the term ??
- Interval/Ratio; it is like the mean, medium etc.
It is important to know which variable you need to take and combine a level of measurement.
Types of variables and methods of analysis
(2) Recap lineair regression analysis (if dependent variable is metric)
Example dataset;
Independent variable is size and age
,i = observations
Bijvoorbeeld : X1 = size - X2 = age
Linear Regression
, Residual = the difference between the observed and the predicted value
How do you know that the linear line is a good fit? R-square helps with that
The R-spuare always had two questions; Can we use a model? How good does the model fit?
The institution of the formula is important for the test.
A-square is a figure between 0 and 1
Ei = R??
The line needs to be close to the dots.
Check model assumptions:
You need to check model assumptions. After that you can draw conclusions.
1. The sample consists of independent observations
The indicators need to be independent; age and size is independent.