SPSSS Andy Field – summary Chapter 5
Bias = Things that lead us to a wrong conclusion.
When we estimate a parameter we compute an estimate of how well it
represents the population, such as a standard error or confidence intervals, or
test statistics and their associated probabilities.
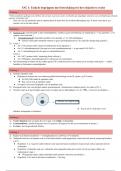
Assumption = a condition that ensures that what you’re attempting to do
works. When the assumption is not met, it is called a violation. The main
assumptions we look at are (1) additivity and linearity, (2) normality, (3)
homoscedasticity, and (4) independence.
Outlier = a score very different from the rest of the data. An outlier can bias a
parameter estimate, such as decreasing or increasing the mean. Outliers also
affect the sum of squared error dramatically, because we use squared errors, so
any bias created by the outlier is magnified by the fact that deviations are
squared. If the sum of squared errors is biased, so are the standard error and the
confidence intervals.
The assumption of additivity and linearity means that the outcome variable is,
in reality, linearly related to any predictors (i.e. a straight line). If this assumption
is not true, even if all other assumptions are not met, your model is invalid.
The normal distribution is valid to:
1. Parameter estimates: parameters (such as a mean) are affected by non-
normal distributions (such as outliers). It depends on the parameter how
much they are biased, a median is less biased by a skewed distribution
than the mean.
2. Confidence intervals: the standard normal distribution is used to compute
the confidence intervals around a parameter estimate.
3. Null hypothesis significance testing: to test a hypothesis we use the normal
distribution, because we assume the parameter has a normal distribution.
4. Errors: any model we fit include some error. These residuals need to be
normally distributed
The assumption of normality: The estimate of the confidence interval needs to
come from a normal distribution, and the sampling distribution must be normal,
and the estimates of the parameters must be normal. (This is not the same as
that the data needs to be normally distributed).
The central limit theorem revisited: As our sample sizes get bigger the sampling
distributions become more normal, up to point at which the sample is big enough
that the sampling distribution is normal. This is the central limit theorem:
regardless of the shape of the population, parameter estimates of that population
will have a normal distribution provided the samples are big enough.
The central limit theorem means that there are a variety of situations in which we
can assume normality regardless of the shape of our sample data. If our sample
is large enough we do not need to worry about the assumption of normality.
If you want to estimate parameters of your model then normality doesn’t really
matter.
, Homoscedasticity: assume that each of the samples come from populations
with the same variance.
We have to assume homoscedasticity in order to make sure our estimates of the
parameters that define our model and our significance test are accurate.
Example: 10 people are on tour with the loudest band and are measured for how
many hours after the concert these people had ringing in their ears. The scores
are presented by dots in a graph and the means are presented by blocks. In case
there is homoscedasticity the circles will lay around the dots every time the score
is measured. In case there is no homoscedasticity (thus, heteroscedascitiy) the
dots do not lay equally around the blocks, but differ along the y-axis (see page
175 for the example graphs).
If variances for the outcome variable differ along the predictor variable then the
estimates of the parameters within the model will not be optimal.
Heteroscedascitity creates a bias and inconsistency in the estimate of the
standard error.
Independence: this assumption means that the errors in your model are not
related to each other.
Example: Paul and Julie need to answer whether they have seen certain photos
before. In case they are not able to confer, the scores will be independent.
A histogram or a boxplot is an easy way to spot outliers.
Besides frequency distributions the P-plot (probability-probability plot) is another
useful graph for checking normality; it plots the cumulative probability of a
variable against the cumulative probability of a particular distribution. The data
are ranked and sorted, then for each rank the corresponding z-score is calculated
to create an ‘expected value’ that the score should have in a normal distribution.
Next, the score itself is converted to a z-score. The actual z-score is plotted
against the expected z-score. If the data is normally distributed the z-scores will
be the same, and you will get a perfectly diagonal line.
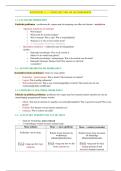
Graphs are particularly useful for looking at normality in big samples; however, in
smaller samples it can be useful to explore the distribution of variables using the
frequencies command. Analyze descriptive statistics frequencies. Select:
quartiles, standard deviation, variance, range, minimum, maximum, standard
error mean, mean, median, mode, skewedness, kurtosis (in statistics).
Positive values of skewness indicate a pile-up of scores on the left of the
distribution, whereas negative values indicate a pile-up on the right. Positive
values of kurtosis indicate a pointy and heavy-tailed distribution, whereas
negative values indicate a flat and light-tailed distribution. The further the value
is from zero, the more likely it is that the date are not normally distributed.
These values can be converted to z-scores, which enables us to (1) compare skew
and kurtosis values in different samples that used different measures, and (2)
calculate a p-value that tells us if the values are significantly different from 0 (i.e.
normal).
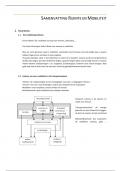
Both assumptions relate to the errors in the model we fit to the data. We can
create a scatterplot of the values of the residuals against the values of the
outcome predicted by our model. In doing so we are looking at whether there is a
systematic relationship between what comes out of the model and the errors in
Bias = Things that lead us to a wrong conclusion.
When we estimate a parameter we compute an estimate of how well it
represents the population, such as a standard error or confidence intervals, or
test statistics and their associated probabilities.
Assumption = a condition that ensures that what you’re attempting to do
works. When the assumption is not met, it is called a violation. The main
assumptions we look at are (1) additivity and linearity, (2) normality, (3)
homoscedasticity, and (4) independence.
Outlier = a score very different from the rest of the data. An outlier can bias a
parameter estimate, such as decreasing or increasing the mean. Outliers also
affect the sum of squared error dramatically, because we use squared errors, so
any bias created by the outlier is magnified by the fact that deviations are
squared. If the sum of squared errors is biased, so are the standard error and the
confidence intervals.
The assumption of additivity and linearity means that the outcome variable is,
in reality, linearly related to any predictors (i.e. a straight line). If this assumption
is not true, even if all other assumptions are not met, your model is invalid.
The normal distribution is valid to:
1. Parameter estimates: parameters (such as a mean) are affected by non-
normal distributions (such as outliers). It depends on the parameter how
much they are biased, a median is less biased by a skewed distribution
than the mean.
2. Confidence intervals: the standard normal distribution is used to compute
the confidence intervals around a parameter estimate.
3. Null hypothesis significance testing: to test a hypothesis we use the normal
distribution, because we assume the parameter has a normal distribution.
4. Errors: any model we fit include some error. These residuals need to be
normally distributed
The assumption of normality: The estimate of the confidence interval needs to
come from a normal distribution, and the sampling distribution must be normal,
and the estimates of the parameters must be normal. (This is not the same as
that the data needs to be normally distributed).
The central limit theorem revisited: As our sample sizes get bigger the sampling
distributions become more normal, up to point at which the sample is big enough
that the sampling distribution is normal. This is the central limit theorem:
regardless of the shape of the population, parameter estimates of that population
will have a normal distribution provided the samples are big enough.
The central limit theorem means that there are a variety of situations in which we
can assume normality regardless of the shape of our sample data. If our sample
is large enough we do not need to worry about the assumption of normality.
If you want to estimate parameters of your model then normality doesn’t really
matter.
, Homoscedasticity: assume that each of the samples come from populations
with the same variance.
We have to assume homoscedasticity in order to make sure our estimates of the
parameters that define our model and our significance test are accurate.
Example: 10 people are on tour with the loudest band and are measured for how
many hours after the concert these people had ringing in their ears. The scores
are presented by dots in a graph and the means are presented by blocks. In case
there is homoscedasticity the circles will lay around the dots every time the score
is measured. In case there is no homoscedasticity (thus, heteroscedascitiy) the
dots do not lay equally around the blocks, but differ along the y-axis (see page
175 for the example graphs).
If variances for the outcome variable differ along the predictor variable then the
estimates of the parameters within the model will not be optimal.
Heteroscedascitity creates a bias and inconsistency in the estimate of the
standard error.
Independence: this assumption means that the errors in your model are not
related to each other.
Example: Paul and Julie need to answer whether they have seen certain photos
before. In case they are not able to confer, the scores will be independent.
A histogram or a boxplot is an easy way to spot outliers.
Besides frequency distributions the P-plot (probability-probability plot) is another
useful graph for checking normality; it plots the cumulative probability of a
variable against the cumulative probability of a particular distribution. The data
are ranked and sorted, then for each rank the corresponding z-score is calculated
to create an ‘expected value’ that the score should have in a normal distribution.
Next, the score itself is converted to a z-score. The actual z-score is plotted
against the expected z-score. If the data is normally distributed the z-scores will
be the same, and you will get a perfectly diagonal line.
Graphs are particularly useful for looking at normality in big samples; however, in
smaller samples it can be useful to explore the distribution of variables using the
frequencies command. Analyze descriptive statistics frequencies. Select:
quartiles, standard deviation, variance, range, minimum, maximum, standard
error mean, mean, median, mode, skewedness, kurtosis (in statistics).
Positive values of skewness indicate a pile-up of scores on the left of the
distribution, whereas negative values indicate a pile-up on the right. Positive
values of kurtosis indicate a pointy and heavy-tailed distribution, whereas
negative values indicate a flat and light-tailed distribution. The further the value
is from zero, the more likely it is that the date are not normally distributed.
These values can be converted to z-scores, which enables us to (1) compare skew
and kurtosis values in different samples that used different measures, and (2)
calculate a p-value that tells us if the values are significantly different from 0 (i.e.
normal).
Both assumptions relate to the errors in the model we fit to the data. We can
create a scatterplot of the values of the residuals against the values of the
outcome predicted by our model. In doing so we are looking at whether there is a
systematic relationship between what comes out of the model and the errors in