Lecture 1: Introduction to Data Mining
What is data mining?
“Data mining is the study of collecting, cleaning, processing, analyzing, and gaining useful
insights from data”.
It is an umbrella term and the methods used relates to different disciplines:
- Knowledge discovery in databases
- Statistics
- Artificial intelligence (important)
- Machine learning perspective (important)
Key aspects:
- Computation vs large data sets:
Trade-off between processing time and memory
- Computation enables analysis of large data sets:
Computers as a tool and with growing data
- Data mining often implies knowledge discovery from databases
From unstructured data to structured knowledge
What are large amounts or Big Data?
(is not only about the size of the data, which is volume but also about the complexity)
Volume:
- Too big for manual analysis
- Too big to fit in RAM
- Too big to store on disk
Variety:
- Range of values: variance
- Outliers, confounders and noise
- Different data types
Velocity:
- Data changes quickly: require results before data changes
- Streaming data (no storage)
1
,Application of data mining
Overview of basic data types
Data points represents by certain domain, is there any relationship or not?
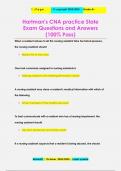
How does it work? The general pipeline of data mining set
The steps above depend on the problem as well as the approach. Some approaches do not
require and explicit feature extraction.
2
,What makes prediction possible?
Fitting data is easy, but predictions are hard.
- Associations between features/target (how the points are related/associated?)
- Numerical: correlation coefficient
- Categorical: mutual information value of x1 contains information about value of x2 (it
is usually common that the sport cars will have a red color- mutual information)
Statistical descriptions of data
1. Measures of central tendency:
- Mean: average
- Median: the middle value in a set of ordered data value
- Mode: the mode for a set of data is the value that occurs most frequently in the set
2. Measuring the spread of data, five number summary:
- Range: difference between max() and min() value
- Quantiles: points taken at regular intervals of a data distribution, dividing it into
essentially equal size consecutive sets. The quantile is the median, the 4 quantiles
are quartiles (3 data points Q1, Q2,Q3), and 100 quartiles are percentiles.
- Interquartile range: IQR = difference between Q3- Q1
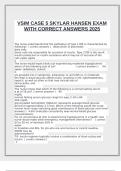
Basic plots: box plot
Includes Q1, median, Q3, min and max values as well as outliers, points that are at least 1,5
IQR further away from Q1 and Q3.
3
, 3. Measuring the dispersion of data
- Variance σ2, measures how far each number in the set is from the mean and thus
from every other number in the set.
- Standard deviation σ, how dispersed the data is in relation to the mean. Low
standard deviation means data are clustered around the mean, and high standard
deviation indicates data are more spread out
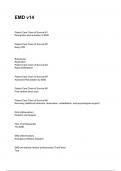
Basic plots: scatter plot
Correlation coefficient
Pearson's r measures the strength of linear relationship (dependency), how things (two
points) are moving together(1 or -1=perfectly aligned , 0 no moving together)
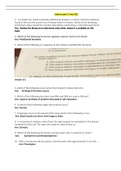
Person’s correlation coefficient
- Numerator: covariance. To what extent the features change together.
- Denominator: product of standard deviations. Makes correlations independent of
units.
4
What is data mining?
“Data mining is the study of collecting, cleaning, processing, analyzing, and gaining useful
insights from data”.
It is an umbrella term and the methods used relates to different disciplines:
- Knowledge discovery in databases
- Statistics
- Artificial intelligence (important)
- Machine learning perspective (important)
Key aspects:
- Computation vs large data sets:
Trade-off between processing time and memory
- Computation enables analysis of large data sets:
Computers as a tool and with growing data
- Data mining often implies knowledge discovery from databases
From unstructured data to structured knowledge
What are large amounts or Big Data?
(is not only about the size of the data, which is volume but also about the complexity)
Volume:
- Too big for manual analysis
- Too big to fit in RAM
- Too big to store on disk
Variety:
- Range of values: variance
- Outliers, confounders and noise
- Different data types
Velocity:
- Data changes quickly: require results before data changes
- Streaming data (no storage)
1
,Application of data mining
Overview of basic data types
Data points represents by certain domain, is there any relationship or not?
How does it work? The general pipeline of data mining set
The steps above depend on the problem as well as the approach. Some approaches do not
require and explicit feature extraction.
2
,What makes prediction possible?
Fitting data is easy, but predictions are hard.
- Associations between features/target (how the points are related/associated?)
- Numerical: correlation coefficient
- Categorical: mutual information value of x1 contains information about value of x2 (it
is usually common that the sport cars will have a red color- mutual information)
Statistical descriptions of data
1. Measures of central tendency:
- Mean: average
- Median: the middle value in a set of ordered data value
- Mode: the mode for a set of data is the value that occurs most frequently in the set
2. Measuring the spread of data, five number summary:
- Range: difference between max() and min() value
- Quantiles: points taken at regular intervals of a data distribution, dividing it into
essentially equal size consecutive sets. The quantile is the median, the 4 quantiles
are quartiles (3 data points Q1, Q2,Q3), and 100 quartiles are percentiles.
- Interquartile range: IQR = difference between Q3- Q1
Basic plots: box plot
Includes Q1, median, Q3, min and max values as well as outliers, points that are at least 1,5
IQR further away from Q1 and Q3.
3
, 3. Measuring the dispersion of data
- Variance σ2, measures how far each number in the set is from the mean and thus
from every other number in the set.
- Standard deviation σ, how dispersed the data is in relation to the mean. Low
standard deviation means data are clustered around the mean, and high standard
deviation indicates data are more spread out
Basic plots: scatter plot
Correlation coefficient
Pearson's r measures the strength of linear relationship (dependency), how things (two
points) are moving together(1 or -1=perfectly aligned , 0 no moving together)
Person’s correlation coefficient
- Numerator: covariance. To what extent the features change together.
- Denominator: product of standard deviations. Makes correlations independent of
units.
4