Samenvatting OPM
Precedence diagram = A diagram that allows one to visualize immediate predecessors
better
- Activity-on-node (AON) = an approach used to create a network diagram, in which
nodes represent activities and arc represent the precedence relationship between
them.
Constructing a precedence diagram:
Desired output rate = Ideally is matched to the staffing or production plan
Cycle time = Maximum time allowed for work a unit at each station
Theoretical Minimum (TM) = benchmark or goal for the smallest number of
stations possible
- = total time required to assemble each unit
Idle time = the total unproductive time for all stations in the assembly of each unit
Efficiency = the ratio of productive time to total time, expressed as a percent
Balance Delay = the amount by which efficiency falls short of 100%
o Balance Delay (%) = 100% - Efficiency
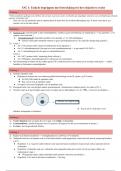
Notatie Operating Characteristic
r Desired output rate in units per hour
c Cycle time in hours
TM Theoretical minimum
n Number of stations
Total time required to assemble each unit
L Average number of customers in the system (waiting and being served)
Lq Average number of customer in the waiting line
W Average time a customer spends in the system (waiting and being
served)
Wq Average time a customer spends waiting
P0 Probability of no customers in the system
Pn Probability of n customers in the system
ρ Utilization rate; the portion of time the system is in use
Et Forecast error for period t
Dt Actual demand in period t
Ft Forecast for period t
Y Dependent variable
X Independent variable
a Y-intercept of the line
b Slope of the line
Precedence diagram = A diagram that allows one to visualize immediate predecessors
better
- Activity-on-node (AON) = an approach used to create a network diagram, in which
nodes represent activities and arc represent the precedence relationship between
them.
Constructing a precedence diagram:
Desired output rate = Ideally is matched to the staffing or production plan
Cycle time = Maximum time allowed for work a unit at each station
Theoretical Minimum (TM) = benchmark or goal for the smallest number of
stations possible
- = total time required to assemble each unit
Idle time = the total unproductive time for all stations in the assembly of each unit
Efficiency = the ratio of productive time to total time, expressed as a percent
Balance Delay = the amount by which efficiency falls short of 100%
o Balance Delay (%) = 100% - Efficiency
Notatie Operating Characteristic
r Desired output rate in units per hour
c Cycle time in hours
TM Theoretical minimum
n Number of stations
Total time required to assemble each unit
L Average number of customers in the system (waiting and being served)
Lq Average number of customer in the waiting line
W Average time a customer spends in the system (waiting and being
served)
Wq Average time a customer spends waiting
P0 Probability of no customers in the system
Pn Probability of n customers in the system
ρ Utilization rate; the portion of time the system is in use
Et Forecast error for period t
Dt Actual demand in period t
Ft Forecast for period t
Y Dependent variable
X Independent variable
a Y-intercept of the line
b Slope of the line