Epidemiologic Formulas and Terminology
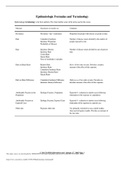
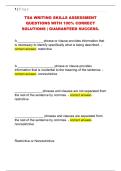
Epidemiologic terminology is far from uniform. The chart clarifies some of the terms used in the course.
Measure Synonyms (or nearly so) Comment
Prevalence Prevalence “rate” (misnomer) Proportion of people with disease at a point in time.
Risk Cumulative Incidence Number of disease onsets divided by the number of
Incidence Proportion people exposed to risk.
Probability of Disease
Rate Incidence Density Number of disease onsets divided by sum of person-
Incidence Rate time.
Central Rate
Hazard Rate
Force of morbidity / mortality
Risk (or Rate) Ratio Relative Risk Ratio of two risks or rates. Provides a relative
Incidence Ratio measure of the effect of the exposure.
Cumulative Incidence Ratio
Incidence Density Ratio
Hazard Ratio
Risk (or Rate) Difference Cumulative Incidence Difference Difference of two risks or rates. Provides an
Incidence Density Difference absolute measure of the effect of the exposure.
Attributable Fraction in the Etiologic Fraction, Population Expected % reduction in number cases following
Population elimination of the exposure in population.
Attributable Fraction in Etiologic Fraction, Exposed Cases Expected % reduction in number cases following
Exposed Cases elimination of the exposure in exposed case.
Odds ratio Exposure odds ratio Use primarily restricted to case-control studies.
Also used in logistic models. Provides an estimate of
the rate ratio.
C:\DATA\HS161\formulas.wpd January 17, 2003 Page 1
This study source was downloaded by 100000829957125 from CourseHero.com on 01-31-2022 08:39:33 GMT -06:00
https://www.coursehero.com/file/33250419/Epidemiology-formulaspdf/
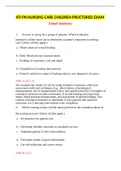
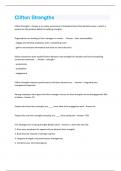
, Chapter 6: Incidence and Prevalence
Basics
no. of existing cases on a specific date
Prevalence =
no. of people in the population on this date
no. of disease onsets
Risk = Cumulativ e Incidence =
size of population initially exposed to risk
no. of disease onsets no. of disease onsets
Rate = Incidence density = ≅
sum of person- time N ⋅ ∆t
where N represents the average (“central”) population at risk and ∆t represents the time of observations (e.g., a one-year
study).
Examples of Specific “Rates”
no. of births
Birth rate per m = ×m
average population size
where m is a population multiplier (e.g., per 1000 individuals).
no. of deaths
Crude death rate per m = ×m
avg. population size
no. of deaths < 1 yr of age
Infant mortality rate per m = ×m
no. of live births
no. of deaths in age group
Age - specific death rate per m = ×m
no. of people in age group
C:\DATA\HS161\formulas.wpd January 17, 2003 Page 2
This study source was downloaded by 100000829957125 from CourseHero.com on 01-31-2022 08:39:33 GMT -06:00
https://www.coursehero.com/file/33250419/Epidemiology-formulaspdf/
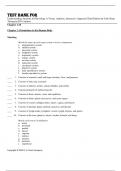
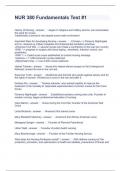
Epidemiologic terminology is far from uniform. The chart clarifies some of the terms used in the course.
Measure Synonyms (or nearly so) Comment
Prevalence Prevalence “rate” (misnomer) Proportion of people with disease at a point in time.
Risk Cumulative Incidence Number of disease onsets divided by the number of
Incidence Proportion people exposed to risk.
Probability of Disease
Rate Incidence Density Number of disease onsets divided by sum of person-
Incidence Rate time.
Central Rate
Hazard Rate
Force of morbidity / mortality
Risk (or Rate) Ratio Relative Risk Ratio of two risks or rates. Provides a relative
Incidence Ratio measure of the effect of the exposure.
Cumulative Incidence Ratio
Incidence Density Ratio
Hazard Ratio
Risk (or Rate) Difference Cumulative Incidence Difference Difference of two risks or rates. Provides an
Incidence Density Difference absolute measure of the effect of the exposure.
Attributable Fraction in the Etiologic Fraction, Population Expected % reduction in number cases following
Population elimination of the exposure in population.
Attributable Fraction in Etiologic Fraction, Exposed Cases Expected % reduction in number cases following
Exposed Cases elimination of the exposure in exposed case.
Odds ratio Exposure odds ratio Use primarily restricted to case-control studies.
Also used in logistic models. Provides an estimate of
the rate ratio.
C:\DATA\HS161\formulas.wpd January 17, 2003 Page 1
This study source was downloaded by 100000829957125 from CourseHero.com on 01-31-2022 08:39:33 GMT -06:00
https://www.coursehero.com/file/33250419/Epidemiology-formulaspdf/
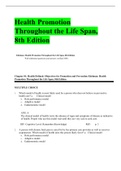
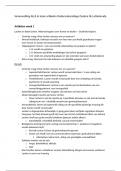
, Chapter 6: Incidence and Prevalence
Basics
no. of existing cases on a specific date
Prevalence =
no. of people in the population on this date
no. of disease onsets
Risk = Cumulativ e Incidence =
size of population initially exposed to risk
no. of disease onsets no. of disease onsets
Rate = Incidence density = ≅
sum of person- time N ⋅ ∆t
where N represents the average (“central”) population at risk and ∆t represents the time of observations (e.g., a one-year
study).
Examples of Specific “Rates”
no. of births
Birth rate per m = ×m
average population size
where m is a population multiplier (e.g., per 1000 individuals).
no. of deaths
Crude death rate per m = ×m
avg. population size
no. of deaths < 1 yr of age
Infant mortality rate per m = ×m
no. of live births
no. of deaths in age group
Age - specific death rate per m = ×m
no. of people in age group
C:\DATA\HS161\formulas.wpd January 17, 2003 Page 2
This study source was downloaded by 100000829957125 from CourseHero.com on 01-31-2022 08:39:33 GMT -06:00
https://www.coursehero.com/file/33250419/Epidemiology-formulaspdf/