Lecture one
What is ‘statistics’?
Descriptive Statistics
• Organizing, summarizing, and presenting data by:
• Using numerical techniques
• Using graphical techniques
Inferential Statistics
• Can we draw inferences about characteristics of populations based on sample data?
• Sample should be random or representative (everyone equally likely to be included)
Key Statistical Concepts
Population
• A population is the group of all items of interest to a statistics practitioner
• A parameter is a descriptive measure of a population
Sample
• A sample is a set of data drawn from the population
• A statistic is a descriptive measure of a sample
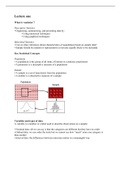
Variables and types of data
A variable is a number or a label used to describe observations in a sample:
• Nominal data: all we can say is that the categories are different but they have no order
• Ordinal data: we can order the traits but we cannot say how “much” more one category is
than another
• Interval data: the differences between outcomes matter in a meaningful way
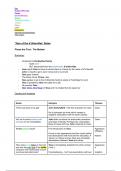
, Nominal, Ordinal, and Interval Data
Discrete versus continuous random variables
Discrete:
• Usually a finite number of outcomes
• exception: counts
• ‘gaps’ between possible values
Continuous:
• A range of possible values
• They have an infinite number of possible values between any two end points
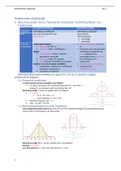
Properties of distributions
Measures of variability (spreading)
• range, standard deviation, variance
Measures of central tendency
• mode, median, mean
Number of modal classes
• unimodal, bimodal
Shape of the distribution
• symmetric, skewed
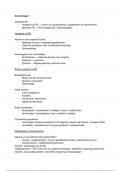
Shape of a distribution: question
Consider a random variable X that follows a positively skewed distribution with mean A,
median B, and mode C. Which of the following statements is
true?
a) p(X > A) = 0.5
b) p(X > B) = 0.5
c) p(X > C) = 0.5
What is ‘statistics’?
Descriptive Statistics
• Organizing, summarizing, and presenting data by:
• Using numerical techniques
• Using graphical techniques
Inferential Statistics
• Can we draw inferences about characteristics of populations based on sample data?
• Sample should be random or representative (everyone equally likely to be included)
Key Statistical Concepts
Population
• A population is the group of all items of interest to a statistics practitioner
• A parameter is a descriptive measure of a population
Sample
• A sample is a set of data drawn from the population
• A statistic is a descriptive measure of a sample
Variables and types of data
A variable is a number or a label used to describe observations in a sample:
• Nominal data: all we can say is that the categories are different but they have no order
• Ordinal data: we can order the traits but we cannot say how “much” more one category is
than another
• Interval data: the differences between outcomes matter in a meaningful way
, Nominal, Ordinal, and Interval Data
Discrete versus continuous random variables
Discrete:
• Usually a finite number of outcomes
• exception: counts
• ‘gaps’ between possible values
Continuous:
• A range of possible values
• They have an infinite number of possible values between any two end points
Properties of distributions
Measures of variability (spreading)
• range, standard deviation, variance
Measures of central tendency
• mode, median, mean
Number of modal classes
• unimodal, bimodal
Shape of the distribution
• symmetric, skewed
Shape of a distribution: question
Consider a random variable X that follows a positively skewed distribution with mean A,
median B, and mode C. Which of the following statements is
true?
a) p(X > A) = 0.5
b) p(X > B) = 0.5
c) p(X > C) = 0.5