Summary statistics
Week 1
Lecture 1 + Q&A 1
Statistical models = to represent what is happening in the real world; consists of parameters
and variables (perspective of reality, different ways of representing reality).
Variables = measured constructs and vary across people in the sample.
Parameters (b) = estimated from the data and represent constant relations between
variables in the model (act on variables).
SO: we compute the model parameters in the sample to estimate the value in the population.
The mean is a model of what happens in the real world; the typical score (not a perfect
representation of the data). A random distribution tells that the fit is not perfect to see what the
distribution means: look at the error!
Mean = value from which the (squared) scores deviate least (least error). Simple statistical
model of the center of a distribution of scores.
Standard deviation = how much observations in our sample differ from the mean value within our
sample.
Standard error = how well the sample mean represents the population mean. The SE is the standard
deviation of the sampling distribution of a statistic.
Mean squared error is more informative to compute the average dispersion. This is because we use
sample data to estimate the model fit in the population. N-1 because we estimate the population
mean with the sample mean.
MSE (s) is variance. Variance is a special case of a more general principle that you can apply to more
complex models; which is that the fit of the model can be assessed with either the sum of squared
error or the MSE.
1
,Mean (x̅) and SD (s) are obtained from a sample, but used to estimate the mean () and SD () of the
population.
(SEx = standard error of the mean)
S is sample standard deviation; the larger N, the smaller SE and the more the sample mean is
representative of the population.
Margin of error (t(df) * SE) is smaller in larger samples larger samples produce more reliable
estimate of the population mean.
Confidence interval: for 95% of all possible samples the population mean will be within its limits.
95% CI calculated by assuming the t-distribution as representative of the sampling
distribution. Look up t-distribution in table.
APA how to report: M = 8.0; 95% CI [6.0, 10.0]
Graphical representation: error bars with bars representing “margin of error”
Important: check whether zero falls within CI, if yes, you cannot say that it differs from zero because
it is within the range.
Interpretation:
CI is a range of plausible values for . Values outside Ci are relatively implausible.
The lower limit of CI implies a statistically significant improvement in …, but not a clinically
relevant one. The upper limit implies a clinically important change.
The margin of error is …: we can be 95% confident that our point estimate is no more than 2
points from the true value of .
The smaller the margin of error the more precise our estimate is.
Null hypothesis, H0 there is not effect
Notation: H0: = 0
Alternative hypothesis, H1
Notation: H1: 0
we reject our null hypothesis because we find our sample result unlikely when the null hypothesis
would be true.
2
, When our H0 concerns one population mean (H0: = 0) NHST = one-sample t-test. SO: any value
outside 95% CI has p <.05
When our H0 concerns the difference between two independent population mean (H0: 1 - 2 = 0)
NHST = independent-samples t-test. The amount of overlap of the 95% Cis of the two sample means,
helps us infer the p-value of the independent samples t-test.
Effect size = objective and standardized measure of the magnitude of the observed effect. There are
several effect size measures:
Cohen’s d: when looking at differences between groups
Pearson’s r or R-squared: when looking at correlations
(Partial) eta-squared: when doing multiple variables.
Rules of thumb for interpreting effect sizes:
1. R = .1, d = .2 small effect explains 1% of the total variance
2. R = .3, d = .5 medium effect explains 9% of the total variance
3. R = .5, d = .8 large effect explains 25% of the total variance
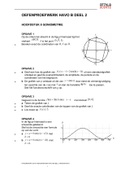
Pooled standard deviation:
Be aware of:
Significant effect does not mean important effect
o Non-significant effect does not mean H0 is true.
o Simplistic all-or-nothing thinking
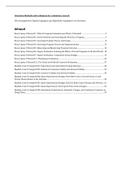
Type 1 errors = you’re claiming there is an effect
when in fact there is not (alpha level)
Type 2 errors = you’re claiming there is no effect
in the population but there actually is (beta level)
P-values can vary greatly from sample to sample
Test statistic = statistic for which we know how frequently different values occur.
How to report NHST:
1. Report raw effect (parameter) with 95% CI, give interpretation of both limits of 95%.
2. Report test statistic; statistic, df, exact p-values.
3. Report and interpret effect size (or standardized parameter).
E.g. (M = 8.0, 95% CI [6.0, 10.0], t(4) = 11.27, p < .001, d=2.5)
3
Week 1
Lecture 1 + Q&A 1
Statistical models = to represent what is happening in the real world; consists of parameters
and variables (perspective of reality, different ways of representing reality).
Variables = measured constructs and vary across people in the sample.
Parameters (b) = estimated from the data and represent constant relations between
variables in the model (act on variables).
SO: we compute the model parameters in the sample to estimate the value in the population.
The mean is a model of what happens in the real world; the typical score (not a perfect
representation of the data). A random distribution tells that the fit is not perfect to see what the
distribution means: look at the error!
Mean = value from which the (squared) scores deviate least (least error). Simple statistical
model of the center of a distribution of scores.
Standard deviation = how much observations in our sample differ from the mean value within our
sample.
Standard error = how well the sample mean represents the population mean. The SE is the standard
deviation of the sampling distribution of a statistic.
Mean squared error is more informative to compute the average dispersion. This is because we use
sample data to estimate the model fit in the population. N-1 because we estimate the population
mean with the sample mean.
MSE (s) is variance. Variance is a special case of a more general principle that you can apply to more
complex models; which is that the fit of the model can be assessed with either the sum of squared
error or the MSE.
1
,Mean (x̅) and SD (s) are obtained from a sample, but used to estimate the mean () and SD () of the
population.
(SEx = standard error of the mean)
S is sample standard deviation; the larger N, the smaller SE and the more the sample mean is
representative of the population.
Margin of error (t(df) * SE) is smaller in larger samples larger samples produce more reliable
estimate of the population mean.
Confidence interval: for 95% of all possible samples the population mean will be within its limits.
95% CI calculated by assuming the t-distribution as representative of the sampling
distribution. Look up t-distribution in table.
APA how to report: M = 8.0; 95% CI [6.0, 10.0]
Graphical representation: error bars with bars representing “margin of error”
Important: check whether zero falls within CI, if yes, you cannot say that it differs from zero because
it is within the range.
Interpretation:
CI is a range of plausible values for . Values outside Ci are relatively implausible.
The lower limit of CI implies a statistically significant improvement in …, but not a clinically
relevant one. The upper limit implies a clinically important change.
The margin of error is …: we can be 95% confident that our point estimate is no more than 2
points from the true value of .
The smaller the margin of error the more precise our estimate is.
Null hypothesis, H0 there is not effect
Notation: H0: = 0
Alternative hypothesis, H1
Notation: H1: 0
we reject our null hypothesis because we find our sample result unlikely when the null hypothesis
would be true.
2
, When our H0 concerns one population mean (H0: = 0) NHST = one-sample t-test. SO: any value
outside 95% CI has p <.05
When our H0 concerns the difference between two independent population mean (H0: 1 - 2 = 0)
NHST = independent-samples t-test. The amount of overlap of the 95% Cis of the two sample means,
helps us infer the p-value of the independent samples t-test.
Effect size = objective and standardized measure of the magnitude of the observed effect. There are
several effect size measures:
Cohen’s d: when looking at differences between groups
Pearson’s r or R-squared: when looking at correlations
(Partial) eta-squared: when doing multiple variables.
Rules of thumb for interpreting effect sizes:
1. R = .1, d = .2 small effect explains 1% of the total variance
2. R = .3, d = .5 medium effect explains 9% of the total variance
3. R = .5, d = .8 large effect explains 25% of the total variance
Pooled standard deviation:
Be aware of:
Significant effect does not mean important effect
o Non-significant effect does not mean H0 is true.
o Simplistic all-or-nothing thinking
Type 1 errors = you’re claiming there is an effect
when in fact there is not (alpha level)
Type 2 errors = you’re claiming there is no effect
in the population but there actually is (beta level)
P-values can vary greatly from sample to sample
Test statistic = statistic for which we know how frequently different values occur.
How to report NHST:
1. Report raw effect (parameter) with 95% CI, give interpretation of both limits of 95%.
2. Report test statistic; statistic, df, exact p-values.
3. Report and interpret effect size (or standardized parameter).
E.g. (M = 8.0, 95% CI [6.0, 10.0], t(4) = 11.27, p < .001, d=2.5)
3