OCR AS Physics Revision Notes savemyexams.co.uk
YOUR NOTES
1.2 Handling Data ⬇
CONTENTS
1.2.1 Presenting & Interpreting Results
1.2.2 Analysing Quantitative Data
1.2.3 Plotting & Interpreting Graphs
1.2.4 Evaluating Results & Drawing Conclusions
1.2.5 Observations & Measurements
1.2.6 Presenting in a Scientific Way
1.2.7 Use of Software & Tools
1.2.8 Research & Citation Skills
1.2.9 Precision, Accuracy & Experimental Limitations
1.2.10 Significant Figures
1.2.11 Methods to Increase Accuracy
1.2.1 PRESENTING & INTERPRETING RESULTS
Presenting Observations & Data
Data can be presented in a variety of ways, such as on graphs, charts, or tables
Tables are applicable to any experiment yielding data
Graphs, on the other hand, are a little trickier depending on the type of data collected e.g.
quantitative or qualitative
Quantitative data uses numerical values
Qualitative data is observed but not measured with a numerical value e.g. colour
© 2015-2021 Save My Exams Ltd
OCR AS Physics Resources Page 1
REVISION NOTES TOPIC QUESTIONS PAST PAPERS
, OCR AS Physics Revision Notes savemyexams.co.uk
YOUR NOTES
1.2 Handling Data ⬇
Presenting Data in a Table
When taking readings, a sensible range should be taken, and the values should all be stated
to an appropriate number of significant figures or decimal places
This is usually the same number as the resolution of the measuring instrument
The columns in any table should have both a quantity and a unit in their heading
When labelling columns, the names of the quantities should be separated from their
unit by a forward slash ( / )
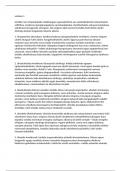
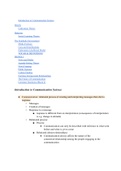
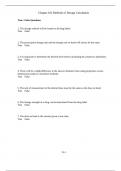
For data displayed in a table:
The first column should contain the independent variable
The second column should contain the dependent variable
If repeat readings of the dependent variable are required, these should be included
with a column for the mean value at the end
Any columns required for processing data e.g. calculations should come after this
Conventions for presenting data in a table. The length is the independent variable and
the frequency is the dependent variable
© 2015-2021 Save My Exams Ltd
OCR AS Physics Resources Page 2
REVISION NOTES TOPIC QUESTIONS PAST PAPERS
, OCR AS Physics Revision Notes savemyexams.co.uk
YOUR NOTES
1.2 Handling Data ⬇
Presenting Data on a Graph
All readings, including suspected anomalous results, should be plotted on a graph so that
they can be easily identified
When taking repeat readings, it is the mean value that is plotted
The way data is presented on a graph depends on what type of data it is
Discrete data
Only certain values can be taken, normally a whole number e.g. number of students
This should be displayed on a scatter graph or bar chart
Continuous data
Can take any value on a scale e.g. voltage in a circuit
This should be displayed on a line or scatter graph
Categorical data
Values that can be sorted into categories e.g. types of material
This should be displayed on a pie or bar chart
Ordered data
Data that can be put in ordered categories e.g. low, medium, high
This should be displayed on a bar chart
Processing, Analysing & Interpreting Experimental Results
After an experiment has been carried out, sometimes the raw results will need to be
processed before they are in a useful or meaningful format
Sometimes, various calculations will need to be carried out in order to get the data in the
form of a straight line
This is normally done by comparing the equation to that of a straight line: y = mx + c
© 2015-2021 Save My Exams Ltd
OCR AS Physics Resources Page 3
REVISION NOTES TOPIC QUESTIONS PAST PAPERS
, OCR AS Physics Revision Notes savemyexams.co.uk
YOUR NOTES
1.2 Handling Data ⬇
Worked Example
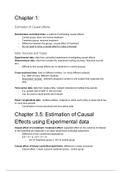
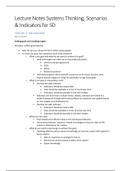
A student measures the background radiation count in a laboratory and obtains the following
readings:
The student is trying to verify the inverse square law of gamma radiation on a sample of
Radium-226. He collects the following data:
Use this data to determine if the student’s data follows an inverse square law.
Step 1: Determine a mean value of background radiation
© 2015-2021 Save My Exams Ltd
OCR AS Physics Resources Page 4
REVISION NOTES TOPIC QUESTIONS PAST PAPERS
YOUR NOTES
1.2 Handling Data ⬇
CONTENTS
1.2.1 Presenting & Interpreting Results
1.2.2 Analysing Quantitative Data
1.2.3 Plotting & Interpreting Graphs
1.2.4 Evaluating Results & Drawing Conclusions
1.2.5 Observations & Measurements
1.2.6 Presenting in a Scientific Way
1.2.7 Use of Software & Tools
1.2.8 Research & Citation Skills
1.2.9 Precision, Accuracy & Experimental Limitations
1.2.10 Significant Figures
1.2.11 Methods to Increase Accuracy
1.2.1 PRESENTING & INTERPRETING RESULTS
Presenting Observations & Data
Data can be presented in a variety of ways, such as on graphs, charts, or tables
Tables are applicable to any experiment yielding data
Graphs, on the other hand, are a little trickier depending on the type of data collected e.g.
quantitative or qualitative
Quantitative data uses numerical values
Qualitative data is observed but not measured with a numerical value e.g. colour
© 2015-2021 Save My Exams Ltd
OCR AS Physics Resources Page 1
REVISION NOTES TOPIC QUESTIONS PAST PAPERS
, OCR AS Physics Revision Notes savemyexams.co.uk
YOUR NOTES
1.2 Handling Data ⬇
Presenting Data in a Table
When taking readings, a sensible range should be taken, and the values should all be stated
to an appropriate number of significant figures or decimal places
This is usually the same number as the resolution of the measuring instrument
The columns in any table should have both a quantity and a unit in their heading
When labelling columns, the names of the quantities should be separated from their
unit by a forward slash ( / )
For data displayed in a table:
The first column should contain the independent variable
The second column should contain the dependent variable
If repeat readings of the dependent variable are required, these should be included
with a column for the mean value at the end
Any columns required for processing data e.g. calculations should come after this
Conventions for presenting data in a table. The length is the independent variable and
the frequency is the dependent variable
© 2015-2021 Save My Exams Ltd
OCR AS Physics Resources Page 2
REVISION NOTES TOPIC QUESTIONS PAST PAPERS
, OCR AS Physics Revision Notes savemyexams.co.uk
YOUR NOTES
1.2 Handling Data ⬇
Presenting Data on a Graph
All readings, including suspected anomalous results, should be plotted on a graph so that
they can be easily identified
When taking repeat readings, it is the mean value that is plotted
The way data is presented on a graph depends on what type of data it is
Discrete data
Only certain values can be taken, normally a whole number e.g. number of students
This should be displayed on a scatter graph or bar chart
Continuous data
Can take any value on a scale e.g. voltage in a circuit
This should be displayed on a line or scatter graph
Categorical data
Values that can be sorted into categories e.g. types of material
This should be displayed on a pie or bar chart
Ordered data
Data that can be put in ordered categories e.g. low, medium, high
This should be displayed on a bar chart
Processing, Analysing & Interpreting Experimental Results
After an experiment has been carried out, sometimes the raw results will need to be
processed before they are in a useful or meaningful format
Sometimes, various calculations will need to be carried out in order to get the data in the
form of a straight line
This is normally done by comparing the equation to that of a straight line: y = mx + c
© 2015-2021 Save My Exams Ltd
OCR AS Physics Resources Page 3
REVISION NOTES TOPIC QUESTIONS PAST PAPERS
, OCR AS Physics Revision Notes savemyexams.co.uk
YOUR NOTES
1.2 Handling Data ⬇
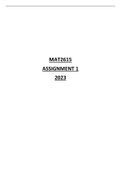
Worked Example
A student measures the background radiation count in a laboratory and obtains the following
readings:
The student is trying to verify the inverse square law of gamma radiation on a sample of
Radium-226. He collects the following data:
Use this data to determine if the student’s data follows an inverse square law.
Step 1: Determine a mean value of background radiation
© 2015-2021 Save My Exams Ltd
OCR AS Physics Resources Page 4
REVISION NOTES TOPIC QUESTIONS PAST PAPERS