Operationeel beheer en logistiek
CHAPTER 1: INTRODUCTION TO OPERATIONS MANAGEMENT
Definitie OM
Operations management:
De bedrijfsfunctie die verantwoordelijk is voor het plannen, coördineren, en controleren van
de middelen nodig om de produkten en diensten van het bedrijf te produceren.
Operations Management Characteristics
• A management function
• An organization’s core function
• In every organization
o Small or large
o Service or Manufacturing
o For-profit or Not-for-profit
Logistiek en Supply Chain
Simplified Organizational Chart
,Information Flows
The Role of OM in Business
,Value Added Defined
Productivity
P = Outputs
Inputs
Productivity Measures
• Partial Measures:
o A ratio of outputs to only one input (e.g.: labor productivity, machine utilization,
energy efficiency)
• Multifactor Measures:
o A ratio of outputs to several, but not all, inputs
• Total Productivity Measures:
o The ratio of outputs to all inputs
Labor Productivity
Example:
• Assume two workers paint twenty-four tables in eight hours:
o Inputs: 16 hours of labor (2 workers x 8 hours)
o Outputs: 24 painted tables
24/16 = 1.5 tb/h
Examples partial productivity measures
, Multifactor Productivity
Convert all inputs & outputs to € value
• Output: 200 units produced sell for 12.00€ each
• Input:
o Materials cost 6.50 € per unit
o 40 hours of labor were required at 10 € an hour
200**6.5 + 40*10 = 2400/1700 = 1.41
Interpreting Productivity Measures
Is the productivity measure of 1.41 in the previous example good or bad?
(vgl met ander bedrijf, opvolgen gedurende shifts,..)
Productivity Growth Rate
Can be used to compare a process’ productivity at a given time (P2) to the same process’
productivity at an earlier time (P1)
Growth Rate = P2-P1/P1
Example:
• Last week a company produced 150 units using 200 hours of labor
• This week, the same company produced 180 units using 250 hours of labor
P1 = 150/200 = 0.75u/h
P2 = 180/250 = 0.72u/h
Growth rate = P2-P1/P1 = 0.72-0.75/0.75 = -0.04 → negative 4% growth
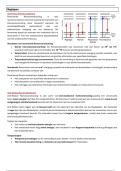
Service – Manufacturing
Services:
• Intangible product
• No inventories
• High customer contact
• Short response time
• Labor intensive
Manufacturing:
• Tangible product
• Can be inventoried
• Low customer contact
• Long response time
• Capital intensive
CHAPTER 1: INTRODUCTION TO OPERATIONS MANAGEMENT
Definitie OM
Operations management:
De bedrijfsfunctie die verantwoordelijk is voor het plannen, coördineren, en controleren van
de middelen nodig om de produkten en diensten van het bedrijf te produceren.
Operations Management Characteristics
• A management function
• An organization’s core function
• In every organization
o Small or large
o Service or Manufacturing
o For-profit or Not-for-profit
Logistiek en Supply Chain
Simplified Organizational Chart
,Information Flows
The Role of OM in Business
,Value Added Defined
Productivity
P = Outputs
Inputs
Productivity Measures
• Partial Measures:
o A ratio of outputs to only one input (e.g.: labor productivity, machine utilization,
energy efficiency)
• Multifactor Measures:
o A ratio of outputs to several, but not all, inputs
• Total Productivity Measures:
o The ratio of outputs to all inputs
Labor Productivity
Example:
• Assume two workers paint twenty-four tables in eight hours:
o Inputs: 16 hours of labor (2 workers x 8 hours)
o Outputs: 24 painted tables
24/16 = 1.5 tb/h
Examples partial productivity measures
, Multifactor Productivity
Convert all inputs & outputs to € value
• Output: 200 units produced sell for 12.00€ each
• Input:
o Materials cost 6.50 € per unit
o 40 hours of labor were required at 10 € an hour
200**6.5 + 40*10 = 2400/1700 = 1.41
Interpreting Productivity Measures
Is the productivity measure of 1.41 in the previous example good or bad?
(vgl met ander bedrijf, opvolgen gedurende shifts,..)
Productivity Growth Rate
Can be used to compare a process’ productivity at a given time (P2) to the same process’
productivity at an earlier time (P1)
Growth Rate = P2-P1/P1
Example:
• Last week a company produced 150 units using 200 hours of labor
• This week, the same company produced 180 units using 250 hours of labor
P1 = 150/200 = 0.75u/h
P2 = 180/250 = 0.72u/h
Growth rate = P2-P1/P1 = 0.72-0.75/0.75 = -0.04 → negative 4% growth
Service – Manufacturing
Services:
• Intangible product
• No inventories
• High customer contact
• Short response time
• Labor intensive
Manufacturing:
• Tangible product
• Can be inventoried
• Low customer contact
• Long response time
• Capital intensive