SPSS Grasple
Inhoud
Simple linear regression.........................................................................................................................2
Multiple regression.................................................................................................................................5
Moderation Analysis using multiple regression....................................................................................11
Moderation analysis using multiple regression in PROCESS.................................................................13
Meditation analysis..............................................................................................................................16
Bootstrapping.......................................................................................................................................20
T-test....................................................................................................................................................21
ANOVA..................................................................................................................................................22
ANCOVA................................................................................................................................................32
MANOVA..............................................................................................................................................39
Repeated Measures analysis................................................................................................................42
Mixed designs.......................................................................................................................................47
Overzicht..............................................................................................................................................49
Open science : Registered Reports.......................................................................................................51
Effect sizes............................................................................................................................................53
1
,Simple linear regression
Regression models describe the relationship between variables by fitting a line to the observed data.
Linear regression models use a straight line. Regression allows you to estimate how a dependent
variable changes as the independent variable(s) change.
Example research question:
Is there a relation between income and happiness (on a scale from 1 to 100)?
Independent variable 1 Numerical:
(predictor variable) ratio/interval
Dependent variable 1 Numerical:
(outcome variable) ratio/interval
correlation coefficient:
To asses the strength of a linear relationship
Pearson’s R
o An absolute value of 1 indicates maximum strength of a relation
between two variable
o A value of 0 indicates no linear relation between the two variables
o Describes the strengths of the corelation, not the causal effects!
The formula
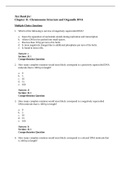
predicted Yvalue=intercept +slope x Xvalue
^y =b0 +b1 x (y= a +bx)
b 0 = intercept b 1 x = slope
Drawing a scatter plot provides you with valuable information about the strength and the direction of
the relationship:
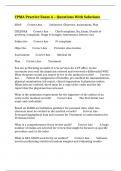
Calculating the predicted value by using the slope (R.C = if x increases by 1, how much
does y increase)
Now that we know the slope we need to figure out where to place it (vertically) on the y-
axis. To be able to make a correct prediction we also need to know the intercept
Intercept = the point where the regression line crosses the y-axis
Now that we know the line's two essential components, we can use these to make
predictions:
predicted Yvalue=intercept +slope x Xvalue
^y =b0 +b1 x (y= a +bx)
b 0 = intercept b 1 x = slope
Note: The hat on y is used to denote that this is not the observed y-score but the predicted y-score.
the least squares method:
a method that statisticians use to draw the most suitable line
2
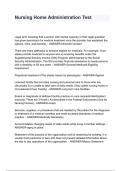
, 1. Draw a scatterplot
2. We use the regression equation to use the values of X to predict the value of Y = the
predicted value. The observed value can be different.
3. The distance between the true value/observed Y and the predicted value ^y
is called the error of residual
Residual = y− ^y
4. Now we have tried to draw the line in such a way that we minimize the
errors.
the positive and negative errors cancel each other. The sum of all errors
then is always zero.
5. When we square the errors, they will always be positive and they do not cancel each
other. This way we can look for the line that will result in the smallest possible sum of
squared errors. This method is called the least squares method.
6. You don’t need to be able to compute the best fitting linear regression model, that is, the
values for B0 and B1, because we have software (SPSS) that provides these values for us. But
then we need to know how to interpret a output
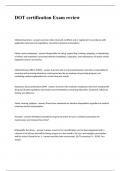
Intercept (spss = constant) & Slope
r-squared: Percentage of the variance
Highest standarized coefficients Beta: is best predictor
The importance of a predictor can only be evaluated using the
Beta-values. The output shows that Position is the strongest
predictor.
B-values: are influenced by the scale on which the variable is
measured so should not be used to evaluate the
importance/relevance of an effect.
p-values: are influenced by sample size and should never be
used to evaluate the importance/relevance of an effect.
7. You want to assess how well the fit of the prediction is with a so called goodness of
fit number. An example of a goodness of fit number is the R-squared.
The R-squared:
The R-squared determines the amount of variance of the response
variables that is explained by the predictor variable. The R-squared is a
proportion between 0 and 1.
If the R-squared is very small, this does not mean that there is no
meaningful relationship between the two variables. The relationship
could still be practically relevant, even though it does not explain a large
amount of variance.
If the R-squared is very large, this does not mean that the model is useful
for predicting new observations. A very large R-squared could be due to
the sample, and might not predict well in a different sample.
3
Inhoud
Simple linear regression.........................................................................................................................2
Multiple regression.................................................................................................................................5
Moderation Analysis using multiple regression....................................................................................11
Moderation analysis using multiple regression in PROCESS.................................................................13
Meditation analysis..............................................................................................................................16
Bootstrapping.......................................................................................................................................20
T-test....................................................................................................................................................21
ANOVA..................................................................................................................................................22
ANCOVA................................................................................................................................................32
MANOVA..............................................................................................................................................39
Repeated Measures analysis................................................................................................................42
Mixed designs.......................................................................................................................................47
Overzicht..............................................................................................................................................49
Open science : Registered Reports.......................................................................................................51
Effect sizes............................................................................................................................................53
1
,Simple linear regression
Regression models describe the relationship between variables by fitting a line to the observed data.
Linear regression models use a straight line. Regression allows you to estimate how a dependent
variable changes as the independent variable(s) change.
Example research question:
Is there a relation between income and happiness (on a scale from 1 to 100)?
Independent variable 1 Numerical:
(predictor variable) ratio/interval
Dependent variable 1 Numerical:
(outcome variable) ratio/interval
correlation coefficient:
To asses the strength of a linear relationship
Pearson’s R
o An absolute value of 1 indicates maximum strength of a relation
between two variable
o A value of 0 indicates no linear relation between the two variables
o Describes the strengths of the corelation, not the causal effects!
The formula
predicted Yvalue=intercept +slope x Xvalue
^y =b0 +b1 x (y= a +bx)
b 0 = intercept b 1 x = slope
Drawing a scatter plot provides you with valuable information about the strength and the direction of
the relationship:
Calculating the predicted value by using the slope (R.C = if x increases by 1, how much
does y increase)
Now that we know the slope we need to figure out where to place it (vertically) on the y-
axis. To be able to make a correct prediction we also need to know the intercept
Intercept = the point where the regression line crosses the y-axis
Now that we know the line's two essential components, we can use these to make
predictions:
predicted Yvalue=intercept +slope x Xvalue
^y =b0 +b1 x (y= a +bx)
b 0 = intercept b 1 x = slope
Note: The hat on y is used to denote that this is not the observed y-score but the predicted y-score.
the least squares method:
a method that statisticians use to draw the most suitable line
2
, 1. Draw a scatterplot
2. We use the regression equation to use the values of X to predict the value of Y = the
predicted value. The observed value can be different.
3. The distance between the true value/observed Y and the predicted value ^y
is called the error of residual
Residual = y− ^y
4. Now we have tried to draw the line in such a way that we minimize the
errors.
the positive and negative errors cancel each other. The sum of all errors
then is always zero.
5. When we square the errors, they will always be positive and they do not cancel each
other. This way we can look for the line that will result in the smallest possible sum of
squared errors. This method is called the least squares method.
6. You don’t need to be able to compute the best fitting linear regression model, that is, the
values for B0 and B1, because we have software (SPSS) that provides these values for us. But
then we need to know how to interpret a output
Intercept (spss = constant) & Slope
r-squared: Percentage of the variance
Highest standarized coefficients Beta: is best predictor
The importance of a predictor can only be evaluated using the
Beta-values. The output shows that Position is the strongest
predictor.
B-values: are influenced by the scale on which the variable is
measured so should not be used to evaluate the
importance/relevance of an effect.
p-values: are influenced by sample size and should never be
used to evaluate the importance/relevance of an effect.
7. You want to assess how well the fit of the prediction is with a so called goodness of
fit number. An example of a goodness of fit number is the R-squared.
The R-squared:
The R-squared determines the amount of variance of the response
variables that is explained by the predictor variable. The R-squared is a
proportion between 0 and 1.
If the R-squared is very small, this does not mean that there is no
meaningful relationship between the two variables. The relationship
could still be practically relevant, even though it does not explain a large
amount of variance.
If the R-squared is very large, this does not mean that the model is useful
for predicting new observations. A very large R-squared could be due to
the sample, and might not predict well in a different sample.
3