Stat 200 Midterm Exam
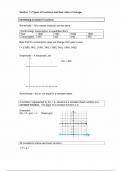
1.) A doctor wishes to estimate the mean triglyceride level of patients two hours after eating a steak dinner. To estimate the mean, you collect data from 22 patients. State the individual, variable, population, sample, parameter, and statistic. Individual: The triglyceride level of patients two hours after eating a steak dinner. Population: Total number of patients. Sample: The 22 patients. Parameter: Population mean. Statistic: Sample mean. 2.) Explain why the relative frequency column of a frequency table might not sum to 1.0. People like numbers that are easier to read. For example, say we did a calculation that gave us the answer 0.. Most of the time, you would round that up to 0.24 because it is easier to convey to someone reading the report than having a table of numbers each with 6 or more decimal places. When that happens, the sum might not end up being 1.0 and instead be 1.2 or something because of rounding. 3.) The Affordable Care Act created a market place for individuals to purchase health care plans. In 2014, the premiums for a 27 year old for the bronze level health insurance are given in the table below. Create a frequency distribution, relative frequency distribution, and cumulative frequency distribution using 6 classes. (All prices in the table are in dollars $) 181 205 197 179 199 205 Min Price: 156 Max Price: 208 Price (Upper Limit) Frequency Distribution Relative Frequency Cumulative Frequency Distribution Percentage 165 2 5.6 2 5.6 174 1 2.8 3 8.3 183 8 22.2 11 30.6 This study source was downloaded by from CourseH on :19:07 GMT -05:00 This study resource was shared via CourseH 192 6 16.7 17 47.2 201 8 22.2 25 69.4 210 11 30.1 36 100.0 36 100.0 4.) Students in Stat 200 took their first exam. The scores are located in the table below. Create a frequency distribution and histogram for the data using class limits that make sense for the data. Describe the shape of the distribution. Min Score: 60 Max Score: 100 The distribution is skewed left, with most students having a higher score. Score (Upper Limit) Frequency Distribution 68 1 76 3 84 5 92 5 100 6 This study source was downloaded by from CourseH on :19:07 GMT -05:00 This study resource was shared via CourseH 5.) Find the mean, median, range, variance and standard deviation of the data set below. The data represent the fixed monthly costs for Sam's Linen Service. Monthly charges Monthly cost ($) Bank charges 482 Cleaning 2208 Food 1750 Computer expenses 2471 Lease payments 2656 Grounds fees 1475 Postage 2117 Uniforms 2600 Delivery fuel 955 Mean: $1857.11 Median: $2117 Range: 2656 – 482 = $2174 Variance: $.54 Standard Deviation: $716.46
École, étude et sujet
- Établissement
- University Of Maryland - Baltimore
- Cours
- STAT 200 (STAT200)
Infos sur le Document
- Publié le
- 8 septembre 2021
- Nombre de pages
- 6
- Écrit en
- 2021/2022
- Type
- AUTRE
- Personne
- Inconnu
Sujets
-
stat 200
-
stat200
-
stat 200 midterm exam
-
stat 200
-
midterm exam
-
midterm
-
study guide
Document également disponible en groupe