18. Break-Even Charts Mark: /10
Figure 1
20000
18000
16000
14000
12000
10000 Total Cost
8000 Total Revenue
6000
4000
2000
0
0 100 200 300 400 500 600 700 800
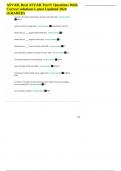
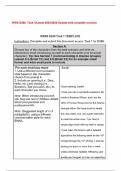
Figure 1 shows Mr Ikitar’s weekly break-even forecast for his new restaurant Strictly Sushi
1. a) What are his forecast fixed costs? [1]
£3,200
b) What is his forecast break-even point? [1]
£6,800 – 300 Customers
c) If his market research proves correct and he attracts 500 customers per week what will his profit
be? [2]
500 Customers – Costs = £9,200, Revenue = £11,200
Profit = Revenue – Costs
Profit = £11,200 - £9,200 = £2,000
2. Unfortunately his forecasts prove inaccurate and his fixed costs rise by £1000
a) Amend the break-even chart to show Mr Ikitar’s new total cost line. Label this TC2. [2]
b) Show his new margin of safety if he achieves 500 customers. Label this MS. [2]
c) Show the difference in profit as a result of the increase in fixed costs. Label this P2. [2]
Explain why a change in variable costs leads to a parallel shift in the total cost line.
A change in variable costs leads to a parallel shift in the total fixed costs. Variable costs are costs
and expenses that change as output varies at a fixed cost - so as variable costs change, so does
the fixed costs at a parallel rate. The variable costs are always changing, the fixed costs don’t
change and therefore the rate at which they both change is parallel
Figure 1
20000
18000
16000
14000
12000
10000 Total Cost
8000 Total Revenue
6000
4000
2000
0
0 100 200 300 400 500 600 700 800
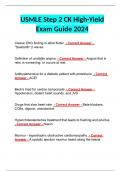
Figure 1 shows Mr Ikitar’s weekly break-even forecast for his new restaurant Strictly Sushi
1. a) What are his forecast fixed costs? [1]
£3,200
b) What is his forecast break-even point? [1]
£6,800 – 300 Customers
c) If his market research proves correct and he attracts 500 customers per week what will his profit
be? [2]
500 Customers – Costs = £9,200, Revenue = £11,200
Profit = Revenue – Costs
Profit = £11,200 - £9,200 = £2,000
2. Unfortunately his forecasts prove inaccurate and his fixed costs rise by £1000
a) Amend the break-even chart to show Mr Ikitar’s new total cost line. Label this TC2. [2]
b) Show his new margin of safety if he achieves 500 customers. Label this MS. [2]
c) Show the difference in profit as a result of the increase in fixed costs. Label this P2. [2]
Explain why a change in variable costs leads to a parallel shift in the total cost line.
A change in variable costs leads to a parallel shift in the total fixed costs. Variable costs are costs
and expenses that change as output varies at a fixed cost - so as variable costs change, so does
the fixed costs at a parallel rate. The variable costs are always changing, the fixed costs don’t
change and therefore the rate at which they both change is parallel