Sophia Statistics Final Milestone
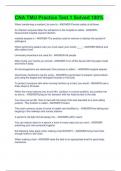
Sophia Statistics Final Milestone This chart shows the number of students of different age groups who participated in a quiz. Which of the following statements about the stack plot is true? There were more male students in the age group 19-21 than in the age group 15-17. There were more male students than female students in the age group 19-21. There were more female students in the age group 17-19 than in any other age group. There were more students in the age group 15-17 than in any other age group. Which of the scenarios below will provide Jay with available data? Going to a local high school and asking the principal for information about students' previous grades, then interviewing a random selection of students about their eating habits. Going to a local high school and asking the principal for information about students' current and previous grades, then interviewing a random selection of students about their eating habits. Going to a local high school and asking the principal for information about students' current and previous grades, then asking the health teacher for the results from a survey students took in health class. Going to a local college and asking current undergraduates to report their grades and eating habits from high school.
École, étude et sujet
- Établissement
- Metropolitan Community College
- Cours
- Sophia Statistics Final Milestone
Infos sur le Document
- Publié le
- 8 avril 2021
- Nombre de pages
- 21
- Écrit en
- 2020/2021
- Type
- Examen
- Contient
- Questions et réponses
Sujets
-
sophia statistics final milestone
Document également disponible en groupe