IOP 2601 EXAM PACK 2018
MAY/ JUNE 2018
SECTION 1
1. False …IOP 2601 predominantly focuses on the results analysis stage
2. 10…add the frequencies
3. 2,the number with the most frequency
4. 0
5. Gender
6. ∑ x² = 125
7. Range …highest – lowest = 5-3 =2
𝑁+1 10+1
8. Median location = = = 5.5
2 2
3+4
Therefore median = = 3.5
2
9. ∑xy= 142
10.True
11.True
12.Common variance = r² x 100 = 0.95² x 100 = 90.25%
13.True
150
14. =0.15
1000
200
15. = 0.2
199
150 200 150 200
16.( x ) +( x ) =0.06
1000 999 999 1000
17.0.005,go to the t table 0.01 two tailed tailed, underneath 0.01 two tailed
you will see 0.005 on the one tailed.
18.False ….Reject Ho only if test statistic is greater than critical value.
1
TUTOR:ADDIE
CONTACT:062 914 2414
, 19. False..Null hypothesis always say there is no difference
20.True ,one tailed hypothesis test is directional.
SECTION 2
1(a) r = 0.92 ,strong positive relationship
(b) if students participate in the support programs they will definetly pass the
exam.
(c) Common variance = r² x 100 = 0.92² x 100 = 84.64%
xx 84.64%
(d) a = y – bx
= 6.4 -2.1 (3)
= 0.1
(e) Y = bx + a
= 2.1 (7) + 0.1
= 14.8
2
TUTOR:ADDIE
CONTACT:062 914 2414
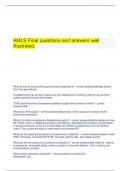
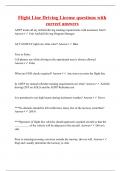
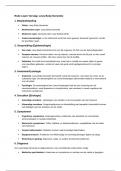
, (f) Y
15 (7;14.8)
10 Y=2.1X + 0.1
Exam score
5
a = 0.1
0 5 10 15 X
Student Programs
𝑆𝑐𝑜𝑟𝑒−𝑅𝐿𝐿
(g) percentile rank = % below + (Interval %)
𝐶𝐿𝐴𝑆𝑆 𝐼𝑁𝑇 𝑊𝐼𝐷𝑇𝐻
66−64.5
= 82 + (12)
5
= 57.5
𝑃𝑅−%𝐵𝐸𝐿𝑂𝑊
(h) score of p = RLL+ (Int width)
𝐼𝑁𝑇𝐸𝑅𝑉𝐴𝐿 %
60−48
= 54.5 + (5)
20
= 57.5
3
TUTOR:ADDIE
CONTACT:062 914 2414
MAY/ JUNE 2018
SECTION 1
1. False …IOP 2601 predominantly focuses on the results analysis stage
2. 10…add the frequencies
3. 2,the number with the most frequency
4. 0
5. Gender
6. ∑ x² = 125
7. Range …highest – lowest = 5-3 =2
𝑁+1 10+1
8. Median location = = = 5.5
2 2
3+4
Therefore median = = 3.5
2
9. ∑xy= 142
10.True
11.True
12.Common variance = r² x 100 = 0.95² x 100 = 90.25%
13.True
150
14. =0.15
1000
200
15. = 0.2
199
150 200 150 200
16.( x ) +( x ) =0.06
1000 999 999 1000
17.0.005,go to the t table 0.01 two tailed tailed, underneath 0.01 two tailed
you will see 0.005 on the one tailed.
18.False ….Reject Ho only if test statistic is greater than critical value.
1
TUTOR:ADDIE
CONTACT:062 914 2414
, 19. False..Null hypothesis always say there is no difference
20.True ,one tailed hypothesis test is directional.
SECTION 2
1(a) r = 0.92 ,strong positive relationship
(b) if students participate in the support programs they will definetly pass the
exam.
(c) Common variance = r² x 100 = 0.92² x 100 = 84.64%
xx 84.64%
(d) a = y – bx
= 6.4 -2.1 (3)
= 0.1
(e) Y = bx + a
= 2.1 (7) + 0.1
= 14.8
2
TUTOR:ADDIE
CONTACT:062 914 2414
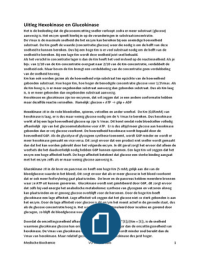
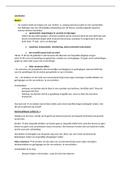
, (f) Y
15 (7;14.8)
10 Y=2.1X + 0.1
Exam score
5
a = 0.1
0 5 10 15 X
Student Programs
𝑆𝑐𝑜𝑟𝑒−𝑅𝐿𝐿
(g) percentile rank = % below + (Interval %)
𝐶𝐿𝐴𝑆𝑆 𝐼𝑁𝑇 𝑊𝐼𝐷𝑇𝐻
66−64.5
= 82 + (12)
5
= 57.5
𝑃𝑅−%𝐵𝐸𝐿𝑂𝑊
(h) score of p = RLL+ (Int width)
𝐼𝑁𝑇𝐸𝑅𝑉𝐴𝐿 %
60−48
= 54.5 + (5)
20
= 57.5
3
TUTOR:ADDIE
CONTACT:062 914 2414