Solution Manual For Probability and Statistics for
Engineers and Scientists, Updated 9th Edition by
Ronald Walpole
iii
,
,Contents
1 Introduction to Statistics and Data Analysis 1
2 Probability 11
3 Random Variables and Probability Distributions 27
4 Mathematical Expectation 41
5 Some Discrete Probability Distributions 55
6 Some Continuous Probability Distributions 67
7 Functions of Random Variables 79
8 Fundamental Sampling Distributions and Data Descriptions 85
9 One- and Two-Sample Estimation Problems 97
10 One- and Two-Sample Tests of Hypotheses 113
11 Simple Linear Regression and Correlation 139
12 Multiple Linear Regression and Certain Nonlinear Regression Models 161
13 One-Factor Experiments: General 175
14 Factorial Experiments (Two or More Factors) 197
15 2k Factorial Experiments and Fractions 219
16 Nonparametric Statistics 233
17 Statistical Quality Control 247
18 Bayesian Statistics 251
iii
, Chapter 1
Introduction to Statistics and Data
Analysis
1.1 (a) 15.
(b) x̄ = 1
15 (3.4+ 2.5+ 4.8+ · · · + 4.8) = 3.787.
(c) Sample median is the 8th value, after the data is sorted from smallest to largest: 3.6.
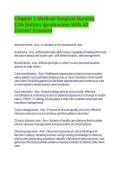
(d) A dot plot is shown below.
2.5 3.0 3.5 4.0 4.5 5.0 5.5
(e) After trimming total 40% of the data (20% highest and 20% lowest), the data becomes:
2.9 3.0 3.3 3.4 3.6
3.7 4.0 4.4 4.8
So. the trimmed mean
is
1
x̄ t r 2 0 = (2.9+ 3.0+ · · · + 4.8) = 3.678.
9
(f) They are about the same.
1.2 (a) Mean=20.7675 and Median=20.610.
(b) x̄ t r1 0 = 20.743.
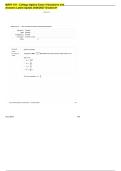
(c) A dot plot is shown below.
18 19 20 21 22 23
(d) No. They are all close to each other.
Copyright ⃝c 2012 Pearson Education, Inc. Publishing as Prentice Hall.
Engineers and Scientists, Updated 9th Edition by
Ronald Walpole
iii
,
,Contents
1 Introduction to Statistics and Data Analysis 1
2 Probability 11
3 Random Variables and Probability Distributions 27
4 Mathematical Expectation 41
5 Some Discrete Probability Distributions 55
6 Some Continuous Probability Distributions 67
7 Functions of Random Variables 79
8 Fundamental Sampling Distributions and Data Descriptions 85
9 One- and Two-Sample Estimation Problems 97
10 One- and Two-Sample Tests of Hypotheses 113
11 Simple Linear Regression and Correlation 139
12 Multiple Linear Regression and Certain Nonlinear Regression Models 161
13 One-Factor Experiments: General 175
14 Factorial Experiments (Two or More Factors) 197
15 2k Factorial Experiments and Fractions 219
16 Nonparametric Statistics 233
17 Statistical Quality Control 247
18 Bayesian Statistics 251
iii
, Chapter 1
Introduction to Statistics and Data
Analysis
1.1 (a) 15.
(b) x̄ = 1
15 (3.4+ 2.5+ 4.8+ · · · + 4.8) = 3.787.
(c) Sample median is the 8th value, after the data is sorted from smallest to largest: 3.6.
(d) A dot plot is shown below.
2.5 3.0 3.5 4.0 4.5 5.0 5.5
(e) After trimming total 40% of the data (20% highest and 20% lowest), the data becomes:
2.9 3.0 3.3 3.4 3.6
3.7 4.0 4.4 4.8
So. the trimmed mean
is
1
x̄ t r 2 0 = (2.9+ 3.0+ · · · + 4.8) = 3.678.
9
(f) They are about the same.
1.2 (a) Mean=20.7675 and Median=20.610.
(b) x̄ t r1 0 = 20.743.
(c) A dot plot is shown below.
18 19 20 21 22 23
(d) No. They are all close to each other.
Copyright ⃝c 2012 Pearson Education, Inc. Publishing as Prentice Hall.