Identifying Relationships Between Variables
Introduction
The cost of living in various cities in the United States is very variable, based on
various economic factors determining the prices of essential commodities, such as groceries.
This paper will find a trend by analyzing the relationship between the Groceries Index and the
Cost of Living Index, which will help determine which cities offer cheaper living conditions
and which cities are more expensive. This paper constructs a scatter plot using data from
seven US cities— New Orleans, Dallas, Tucson, Las Vegas, Orlando, Sacramento, and
Boston. It conducts a regression analysis to examine the relationships between the two
indices. The results show how visualization techniques and probabilistic tools provide insight
into cost dynamics and their impact on residents.
Analysis of Data Table and Scatterplot
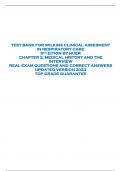
The following table shows the Groceries Index, an independent variable, and the Cost
of Living Index, a dependent variable, for the selected cities.
City Grocery Index Cost of Living Index
New Orleans 73.7 70.2
Dallas 63.8 65.8
Tucson 69.5 63.2
Las Vegas 81.3 75.9
Orlando 73.1 65.6
Sacramento 83.2 75.1
Boston 92.7 83.1
The data collected for these cities were obtained from https://www.numbeo.com/cost-
of-living/region_rankings_current.jsp?region=021.
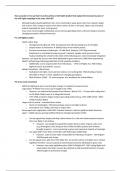
, Scatterplot and Regression Analysis
The scatterplot visually represents the relationship between the seven cities' Groceries
Index and the Cost-of-Living Index. A trendline (regression line) was added to the graph,
along with the equation for the line and the R-squared value, to quantify the strength of the
relationship.
• Regression Line Equation: y = 0.814x – 4.82
• R² Value: 0.927
The equation and the R² value suggest that the relationship between the Groceries
Index and Cost-of-Living Index is strongly positive and linear. This also means that,
according to its R² value of 0.927, about 92.7% of the variation in the Cost-of-Living Index
may be explained by variations in the Groceries Index.
Relationship Between Variables
The Groceries Index and Cost of Living Index analysis show a strong relationship. In
general, cities with high grocery costs have a higher cost of living. The data for the cities in
question is consistent with this trend:
• Boston has the highest Groceries Index, at 92.7, and has the highest Cost of
Living Index, at 83.1 (Numbeo, 2024). This again proves that higher food costs
can significantly impact total living costs.
Introduction
The cost of living in various cities in the United States is very variable, based on
various economic factors determining the prices of essential commodities, such as groceries.
This paper will find a trend by analyzing the relationship between the Groceries Index and the
Cost of Living Index, which will help determine which cities offer cheaper living conditions
and which cities are more expensive. This paper constructs a scatter plot using data from
seven US cities— New Orleans, Dallas, Tucson, Las Vegas, Orlando, Sacramento, and
Boston. It conducts a regression analysis to examine the relationships between the two
indices. The results show how visualization techniques and probabilistic tools provide insight
into cost dynamics and their impact on residents.
Analysis of Data Table and Scatterplot
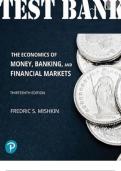
The following table shows the Groceries Index, an independent variable, and the Cost
of Living Index, a dependent variable, for the selected cities.
City Grocery Index Cost of Living Index
New Orleans 73.7 70.2
Dallas 63.8 65.8
Tucson 69.5 63.2
Las Vegas 81.3 75.9
Orlando 73.1 65.6
Sacramento 83.2 75.1
Boston 92.7 83.1
The data collected for these cities were obtained from https://www.numbeo.com/cost-
of-living/region_rankings_current.jsp?region=021.
, Scatterplot and Regression Analysis
The scatterplot visually represents the relationship between the seven cities' Groceries
Index and the Cost-of-Living Index. A trendline (regression line) was added to the graph,
along with the equation for the line and the R-squared value, to quantify the strength of the
relationship.
• Regression Line Equation: y = 0.814x – 4.82
• R² Value: 0.927
The equation and the R² value suggest that the relationship between the Groceries
Index and Cost-of-Living Index is strongly positive and linear. This also means that,
according to its R² value of 0.927, about 92.7% of the variation in the Cost-of-Living Index
may be explained by variations in the Groceries Index.
Relationship Between Variables
The Groceries Index and Cost of Living Index analysis show a strong relationship. In
general, cities with high grocery costs have a higher cost of living. The data for the cities in
question is consistent with this trend:
• Boston has the highest Groceries Index, at 92.7, and has the highest Cost of
Living Index, at 83.1 (Numbeo, 2024). This again proves that higher food costs
can significantly impact total living costs.