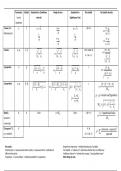
Parameters Statistic Standard Error (Confidence Margin of error Standard Error Test statistic Test statistic formula
Use for Interval) (Significance Test)
Hypothesis
1 mean (also μ x̅ σ ÷ √n z∗σ σ ÷ √n t, df= n-1 x−μ0
z=
Matched pairs) sx √n sx σ /√n
√n t∗s x √n x−μ
t=
√n sx / √ n
√ √ √
2 means μ1 μ2 x̅1 x̅2
s21 s22 s21 s 22 s21 s22 t, df= smaller of (x 1−x 2)
t=
√
+ t∗ + + n1–1 or n2–1 2 2
n1 n2 n1 n2 n1 n2 s1 s2
+
n1 n 2
√ √ √
1 proportion p ^p ^p (1− ^p ) X ^p (1− ^p ) p 0( 1− p0 ) z ^p− p 0
^p = z∗ z=
n n n n
√ p0 (1−p 0)
n
√ √ √
2 proportions p1 p2 ^p1 ^p2 z ( ^p1− ^p2 ) −( p1− p 2)
( )
p1 (1−^
^ p 1) p 1 (1−^
^ p2 ) ^p 2 (1−^p2) 1 1
+^
p2¿ ¿ ¿ z∗ + ^p (1−^p ) + z=
n1 n1 n2 n1 n2 SE D p
X1+ X2 p1− p2=0under null hypothesis
^p=
√
n1 +n 2
1 1
SED = ^p (1− ^p )( + )
p
n1 n2
Slope β1 β1 b1 Given t∗SEb Given t, df= n–2 b1−hypothesized value
1
t=
(constant = SE b 1
y-intercept)
Chi-square Χ2 (2 Χ2 Χ2, df (observed−expected)2
χ 2=∑
cat. variables) k= (r–1)(c–1) expected
Key words: Simple linear regression → relationship between 2 variables
Matched pairs → measurements before & after, 2 measurements for 1 individual at Test statistic → ‘evidence of’, ‘determine whether there is a difference’
different time points Confidence interval → ‘estimate the average’, ‘true population mean’
Proportions → ‘success/failure’, ‘satisfied/unsatisfied’, % proportions Other things to note:
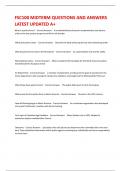