homeworksh 3
3.
1
Central tendency and Variability
a) mean :
1 .1 :
*
=
7 , 21 . 3
:
k =
6
,75
E
ily
-
b) Variance
si
:
=
2)
10 18 ,
1 , 69 46 , 303 1 Standard deviation s
=
.
1 : =
1
=
1
G
1 10 , 20
, 699 , 99
=
, 304 deviation
+ Standard s
3
7
: =
.
=
1 1
G
d) why are the Variance + SD per definition non-negative ?
I both based on the sum of squared deviations (X-)" +
squares can't be negative ,
so sum of
Squares will always be a positive number +
SD is the square root of the Variance +
always a positive
number
Exercise 3
2
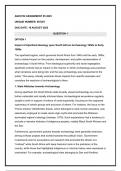
. distribution shapes and normal distributions
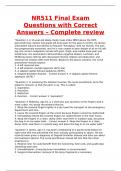
a) When a variable is
normally distributed the ,
mean is equal to the median
b) When a variable is distributed positively skewed the,
mean is larger than the median .
d When a variable is distributed negatively skewed the ,
mean is smaller than the median
Mean ,
Median Median +
Mode Mode Mode
Median
A
Mean
(+) 1-
Positive skew Normal distribution Negative Skew
Exercise 3.
3 covariance and correlation
a) covariance :
T)
)(y
+3
4
,
Ei(x - ,738
-
=
0
(xy
=
=
N
b) Correlation :
rxy
2xy =0 ,735 09
=
=
c) Sign it ort of the covariance tells us whether the relationship btw the Variables is positive or negative .
4 When positive scores on 1
1
. are accompanied by negative scores on exam 1
. 3, those devictions
will be negative as well .
When many deviation scores are
negative ,
the covariance is likely to be nega
tive .
Size of covariance is determined by the SD of the Variables , which are influenced by the scale on
which the variables are measured .
Size of the covariance doesn't say anything about the size of
the relationship bth the variables .
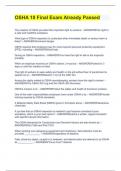
, a) Why are both the sigh and the size of the correlation informative ?
· sign tells us whether the relationship btw the variables is positive or negative .
The correlation is a
Standardized measure + bounded btw-1 and Can interpret sign + size
.
1
!
I . large
5
Correlation of small . medium and
3
1
: :
:
0
, 0
Exercise 3
.
4 Variance and covariance of composite scores
as calculate composite score Yi Xi +X; for each subject c) Yk Xk+X
1
.
=
=
:
,
Id :
.
1
) Yij =
G 4 .) Xij =
4 Id :
1 .1 Yki =
7
4 .)
Yk1
=
4
2 ) Vij 5) Yij 2) 9 5) 4
=
Yk1 Yk1
=
7 7
= =
.
3) 6. G 3) 3
5
Yij Vij Yk1 6) Yk1
=
=
7
=
=
b) Calculate the meantvariance of new Variable
Vi Using regular' formulas :
37
* *,
5
=
=
6
, 17
C) ,3
LT G
. 8334 25 , 33
gi
Z
.1395 , 867 4 , 225 . 054
6
5+
=
= =
= =
=
1 1 2
j
G G
e) covariance between Vij and Yki :
2 ,
67 =
,
444
0
G
#I
. f) Variance of composite scores
Vi
j
and Yik Using composite scores formula :
Scomp
=
Sp +
Sp+21 Si
1 , 67 , 14 + (2 , 33) 0 , 89 + , 33 + (2 50)
, 4 . 22
=
+
+ , 15
-
=
2 1 1 2 0
9) covariance :
Compacompz CikCijk Ci
=
0
, 17 + 0 ,33 + 0
,
44 + 1 -
0
, 17) =
0 43
,
4) Both the Variance and the covariance of a composite score can be calculated in 2 ways +traditional
formulas or those for composite scores , which you use depends on available information
· When scores on diff .
Variables given traditional
:
·
when COVGriance Variance matrix given :
composite formula
Exercise Binary
5
3
. :
items
EiX
=1
a) ·*
5
* ,
=
5
=
= ,
Px
=
0
N
0
2
5(1 5)
5
b) , , . 25
-
= =
0 0 0
5
s =
45 =
0
,
189
C k 726
,
=
=> 0
199 + 71
4) 50 ,726+ (1 -
0
, 726)
5 =
0
,
446
,Exercise 3
6
. 12-scores and converted standard scores)
a) Exam course 1
1
.
# ,5-7,
2
, 2302
7
1.
)
5 =
7 , + z-Score :
=
0 et ...
b) Correlation using -scores :
2 zxzy 2
. 6072 = .
434
Txy
=
0
=
N G
c) Convert exam course to a 1-100 scale with SD =
10 and mean I = 50
T =
/Snew) + Knew
0 , 2302 + 10 + 50 52 , 302
=
a) The Maximum possible score on exam 1
3
. is 10 . The z-score associated with a score of
10 is 2 49
. + T-score becomes 2
49 *10 +50 =74 .
. 9 (rounded to 75) .
Therefore ,
given
the Standard deviation and mean calculated on .
3
1,
it's not possible to get a T-score
Of above 75 .
The minimum possible score on exam 1 3
. is 1 +z-score of -4 .41 +T-Score becomes
-
4 4110
. + 50 =
5.
9 (rounded to 6)
.
Thus ,
given the SD + mean from 3
. 1,
it's not possible
to get a T-score below .
6
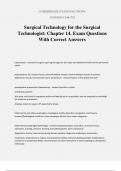
Percentile F(x)
Exercise 3
.
7
ranks and normalited scores
↑
a) percentile rank for score
3309
2
:
w
5 fx) 54) +100
px(Fx-0 600
. (6 -
,
=
0
=
1 , 294 flx)
N 305
55)
,
(11 -
0 +100 =
,75
2
Px
=
,
309
524)100
,
,
135 -
0 =
7 44
Px4
=
309
6) E =
100 and Sa =
15
Ilook up z-scores corresponding to the percentile ranks . Then , calculate T-scures with
formula T =
z(snew= 180) +
(Enew =
15)
, no m w or DC H4 :
Exercise 4 .1 :
NUMBER OF DIMENSIONS
a) 3 Ways to use the eigenvalues to assess #of dimensions :
1) Examine relative size of eigenvalues and find point at which the difference between values becomes
relatively small
2) Eigenvalue Greater than 1
0
. rule :
all dimensions that have eigenvalue greater than 1
.
8
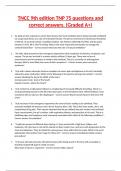
3) Examine scree plot +
trying to find levelling-off point point of inflection) :
the number of dimension
We commonly consider is 1 less than the point where graph levels off
look for advantages and disadvantages in other notes
Exercise 4 . EIGENVALUES AND EXPLAINED VARIANCE
2
:
9) Calculate eigenvalue for the 6th factor :
·
the sum of all eigenvalues is always equal to the total number of variables (3)
Sum of the Other 7
factors is 7
.
4 1
consequently eigenvaire ,
of 6th factor is 1-7 .4 =
0
,
6
6) Calculate the percentage of Variance explained + cumulative percentage
:
Variance explained
,
& I factors in total :
Total Value for 6 = 2
2
. =
0
, 275 127 5%
of
7
Amount of factors S
# 108
1 X
I
6) which factor explains the most variance :
The first factor explains most of the Variance with 5
27 , % of the total variance of all s items
a) scatterplot :
·
Based on the screeplot we'd choose 2 factors ,
as the point of inflection is
Point of at the 3rd factor .
X inflection
There are 3 factors with eigenvalve greater than so this criterion would
·
1,
lead to 3 factors
3.
1
Central tendency and Variability
a) mean :
1 .1 :
*
=
7 , 21 . 3
:
k =
6
,75
E
ily
-
b) Variance
si
:
=
2)
10 18 ,
1 , 69 46 , 303 1 Standard deviation s
=
.
1 : =
1
=
1
G
1 10 , 20
, 699 , 99
=
, 304 deviation
+ Standard s
3
7
: =
.
=
1 1
G
d) why are the Variance + SD per definition non-negative ?
I both based on the sum of squared deviations (X-)" +
squares can't be negative ,
so sum of
Squares will always be a positive number +
SD is the square root of the Variance +
always a positive
number
Exercise 3
2
. distribution shapes and normal distributions
a) When a variable is
normally distributed the ,
mean is equal to the median
b) When a variable is distributed positively skewed the,
mean is larger than the median .
d When a variable is distributed negatively skewed the ,
mean is smaller than the median
Mean ,
Median Median +
Mode Mode Mode
Median
A
Mean
(+) 1-
Positive skew Normal distribution Negative Skew
Exercise 3.
3 covariance and correlation
a) covariance :
T)
)(y
+3
4
,
Ei(x - ,738
-
=
0
(xy
=
=
N
b) Correlation :
rxy
2xy =0 ,735 09
=
=
c) Sign it ort of the covariance tells us whether the relationship btw the Variables is positive or negative .
4 When positive scores on 1
1
. are accompanied by negative scores on exam 1
. 3, those devictions
will be negative as well .
When many deviation scores are
negative ,
the covariance is likely to be nega
tive .
Size of covariance is determined by the SD of the Variables , which are influenced by the scale on
which the variables are measured .
Size of the covariance doesn't say anything about the size of
the relationship bth the variables .
, a) Why are both the sigh and the size of the correlation informative ?
· sign tells us whether the relationship btw the variables is positive or negative .
The correlation is a
Standardized measure + bounded btw-1 and Can interpret sign + size
.
1
!
I . large
5
Correlation of small . medium and
3
1
: :
:
0
, 0
Exercise 3
.
4 Variance and covariance of composite scores
as calculate composite score Yi Xi +X; for each subject c) Yk Xk+X
1
.
=
=
:
,
Id :
.
1
) Yij =
G 4 .) Xij =
4 Id :
1 .1 Yki =
7
4 .)
Yk1
=
4
2 ) Vij 5) Yij 2) 9 5) 4
=
Yk1 Yk1
=
7 7
= =
.
3) 6. G 3) 3
5
Yij Vij Yk1 6) Yk1
=
=
7
=
=
b) Calculate the meantvariance of new Variable
Vi Using regular' formulas :
37
* *,
5
=
=
6
, 17
C) ,3
LT G
. 8334 25 , 33
gi
Z
.1395 , 867 4 , 225 . 054
6
5+
=
= =
= =
=
1 1 2
j
G G
e) covariance between Vij and Yki :
2 ,
67 =
,
444
0
G
#I
. f) Variance of composite scores
Vi
j
and Yik Using composite scores formula :
Scomp
=
Sp +
Sp+21 Si
1 , 67 , 14 + (2 , 33) 0 , 89 + , 33 + (2 50)
, 4 . 22
=
+
+ , 15
-
=
2 1 1 2 0
9) covariance :
Compacompz CikCijk Ci
=
0
, 17 + 0 ,33 + 0
,
44 + 1 -
0
, 17) =
0 43
,
4) Both the Variance and the covariance of a composite score can be calculated in 2 ways +traditional
formulas or those for composite scores , which you use depends on available information
· When scores on diff .
Variables given traditional
:
·
when COVGriance Variance matrix given :
composite formula
Exercise Binary
5
3
. :
items
EiX
=1
a) ·*
5
* ,
=
5
=
= ,
Px
=
0
N
0
2
5(1 5)
5
b) , , . 25
-
= =
0 0 0
5
s =
45 =
0
,
189
C k 726
,
=
=> 0
199 + 71
4) 50 ,726+ (1 -
0
, 726)
5 =
0
,
446
,Exercise 3
6
. 12-scores and converted standard scores)
a) Exam course 1
1
.
# ,5-7,
2
, 2302
7
1.
)
5 =
7 , + z-Score :
=
0 et ...
b) Correlation using -scores :
2 zxzy 2
. 6072 = .
434
Txy
=
0
=
N G
c) Convert exam course to a 1-100 scale with SD =
10 and mean I = 50
T =
/Snew) + Knew
0 , 2302 + 10 + 50 52 , 302
=
a) The Maximum possible score on exam 1
3
. is 10 . The z-score associated with a score of
10 is 2 49
. + T-score becomes 2
49 *10 +50 =74 .
. 9 (rounded to 75) .
Therefore ,
given
the Standard deviation and mean calculated on .
3
1,
it's not possible to get a T-score
Of above 75 .
The minimum possible score on exam 1 3
. is 1 +z-score of -4 .41 +T-Score becomes
-
4 4110
. + 50 =
5.
9 (rounded to 6)
.
Thus ,
given the SD + mean from 3
. 1,
it's not possible
to get a T-score below .
6
Percentile F(x)
Exercise 3
.
7
ranks and normalited scores
↑
a) percentile rank for score
3309
2
:
w
5 fx) 54) +100
px(Fx-0 600
. (6 -
,
=
0
=
1 , 294 flx)
N 305
55)
,
(11 -
0 +100 =
,75
2
Px
=
,
309
524)100
,
,
135 -
0 =
7 44
Px4
=
309
6) E =
100 and Sa =
15
Ilook up z-scores corresponding to the percentile ranks . Then , calculate T-scures with
formula T =
z(snew= 180) +
(Enew =
15)
, no m w or DC H4 :
Exercise 4 .1 :
NUMBER OF DIMENSIONS
a) 3 Ways to use the eigenvalues to assess #of dimensions :
1) Examine relative size of eigenvalues and find point at which the difference between values becomes
relatively small
2) Eigenvalue Greater than 1
0
. rule :
all dimensions that have eigenvalue greater than 1
.
8
3) Examine scree plot +
trying to find levelling-off point point of inflection) :
the number of dimension
We commonly consider is 1 less than the point where graph levels off
look for advantages and disadvantages in other notes
Exercise 4 . EIGENVALUES AND EXPLAINED VARIANCE
2
:
9) Calculate eigenvalue for the 6th factor :
·
the sum of all eigenvalues is always equal to the total number of variables (3)
Sum of the Other 7
factors is 7
.
4 1
consequently eigenvaire ,
of 6th factor is 1-7 .4 =
0
,
6
6) Calculate the percentage of Variance explained + cumulative percentage
:
Variance explained
,
& I factors in total :
Total Value for 6 = 2
2
. =
0
, 275 127 5%
of
7
Amount of factors S
# 108
1 X
I
6) which factor explains the most variance :
The first factor explains most of the Variance with 5
27 , % of the total variance of all s items
a) scatterplot :
·
Based on the screeplot we'd choose 2 factors ,
as the point of inflection is
Point of at the 3rd factor .
X inflection
There are 3 factors with eigenvalve greater than so this criterion would
·
1,
lead to 3 factors