L ec + v re 2
least precise
Norminal :
Variable levels group objects into ↑
calegories , differ in kind , not i n degree
no rank
= ⑲
Die Chart Bar ,
Graph
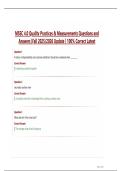
Stemplots :
seperate each observation in to a
system
Order
political party affiliation Gender
Categorical
:
Le . g
,
...
And a leaf that are then plotted to display while main-
Ordinal : Variable group objects in to caregories ,
VCIVES gender
rCNK
) Alves represent caregories
Order
,
differ in Kind , but reflect rank order Impossible to put value in ↓
aining the original values of the Variable .
E
number number doesn't
;
· e
. g
.: SES a s l ow ,
middle , high ,
level of education represent smth ,
meaningful
*201
Interval :
numbers reflect actual amounts , equal 143 157159160164 162 1 6 3 1 75 1 75 1 7 7 183
distance between i n te r va l s O , is abitory difference 212 225
*
23 215 215 219 223
nas SOme ·
G
.
Histogram , stemplats
fa b s e n c e ·
·
Le . 9
:
Temperature grades ,
i
meani RG C 3
14
P
linear transformations allowed
are ladding
Constants or Multiplications) (lascore , grades
Quantit Cil
e
e
Raitio :
Interval scales , but zero point reflects
↳
true
numbers are meaningful
absence of property, scores can be
Related to values , can
be expressed in number
compared as ratios
e . number of questions correct on
sie
:
of the bars
g
re-
ex a m age i absence
Within
B the
corresponding
,
-
. c l a ss
.
add constants multiplications a l l owe d
So
& or are no rank order
↑
·
r
·
an identifier for each case
But NO Linear transformations >
participant number , name or
(Weight l e n g t h reaction t i m e ,
,
most precise ID
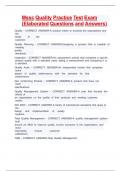
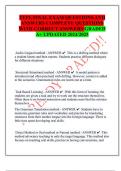
Examing Distrubutions
B
Symmetric distrubtion symmetric if the
A C
:
a is left
S
S
M
and right sides of the graph are approximately
longer
mir ror in ages of each Other
Right-sewed right :
side of the graph is much
than the left side
left-skewed :
left side of the graph is much longer
than the right side
X Variable
Describing Distrubutions with numbers
"x-bar" value
Saverage
Measuring ~
Center
·
:
:
differente
↓WO
M
"Center"
·
Median
:
LTv middle valve
·
Mode (Valve that appears most often)
Measuring spread
·
:
of
&Good measure
because
ra
calculation Square
↓
Quartiles C o re s SD
·
!
· Standard Deviation
only for quantative variables
M
Me DICH
5
:
e percentile
Mean cannot resist the influence of
extreme observations :
it's not a resistant
measure of center/presistant measure
-
is sometimes called 'robust measure
Median is more resistant than median
gefa
·
if adistribution is exactly symmetric
the meantmedian are exactly the same
-
· and
Deviation Standard
Deviation
n
Measuring Spread Quartile
:
Percentile percentage of scores lower
flects the
·
re S
Or equal to a par ticular score &
G
s =
n1(x- x) -
scores
=
2
=
:
6 6
25
36 ↳ s
= =
,
4
-
=
-
1
=M
V
V ,41
V
↓ Add all scores
:
number of scores
= 1
Q
5
55 21 ,
Qu median
=
3
Min
=
2
:
=
.
5
11 ,
,LECHU 2: par t
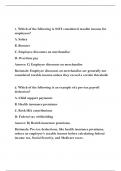
Standard normal distrubutions
Table entry for 2
lable entry
=
0
.7918
is always the area for z
=
. 81
Suppose obtained . of the 3
. The
0
.
a exam mean score
you
7
6 1 .
5
under the cur ve
on this exam is 5. and the SD is 1
.401 . The scores follow a
to the left of 2
distrubution What with
.
Normal the students
is
population of
M ·
,
&
·
a score of 6 .
7
or lower
?
WI
z-Score
·
(6 . 5)
-5 .
=12
:
7
=
0
,8
1, 451
* Table
:
Standard normal probabilities
·
A
(P(Z0 , 81) P(zx0;
, 81) =
,7910 · *
e
0
I I
50 ,7911 of 79 , %1 of the students obtained a .
1
7
, 0
6
3
or l owe r
z
=
0
. 81
Standard normal t a b l e Example
:
·How tall is a man that is taller than exactly 10% of men
aged 18-24 ?
Lo o k up the probability closest to 0
. 10 in the table
Mh
We need to "unstandardize" the z- s c o re to find the
·
·
mean
-
·
Observed va l ex :
x = =
x =
x +
2x5x
SD
* 70 + 1 -
1
, 28)x(2 ,B) =
X
&
&
-
&
70 + 1 5 8)
, 66 ,42
=
-
3
12 =
-
1
, 28
~
mecire & ·Manuel
,fet A
Moore Mccabe , , crais
cases :
objects described by a set of data
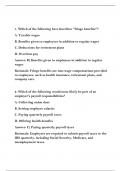
A Tail
Categorical Variable places of
.
a case in to one of ex t re m e values a distrubution
I
Variables :
characteristic of a case
s eve r a l or
calegories Mode major peak
.
groups .
a
Different cases have different values of the
A quantitative variable takes numerical value for Unimodal distribution with one
major peak
Variables label is special variable used
operations
a
which arithmetic adding
A
such as and distribution with
Biomodal
.
two p e a ks
in some data sets to uniquely identify different averaging make sense .
Trimodal distribution with t h re e p e a ks
cases .
C KartiCS .
and e
C Cnumber
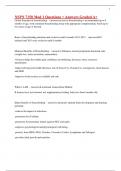
Summary
to calculate the quartiles The five-number of set obser vations consists of
summary of
:
a
Arrange the obser vations in
increasing order and locale the observation the first third
-
smallest , quartile ,
the median, the
the median M in the ordered list of observations .
Quartile ,
and the largest observation ,
written in order from small-
2 The quartile obser- symbols the five-number
.
first Q1
is the median of the est to
largest .
In ,
summary is :
Va t i o n s w h os e positions in the ordered list are to the Minimum Qu M Q2 Maximum
left of the location of the Overall median
3 . The third quartile a,
is the median of the obser-
nterquartile range 2
The interquartile range IQR i s the distance between the first
Vations whose positions in the ordered list are to
and third quar tiles
:
IQR =
Q3-Q 1
& call an o b s e r va t i o n a suspected outlier if it falls more
the
right of the location of the Overall median than 5 X/ Q R
, below the
1
first quartile or a b ove the
third quartile .
This is called the 1 5x1QR
. Rule .
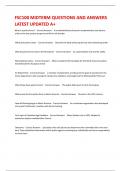
3 VI t also called box and whiskers piots
160-
-
A boxplot graph of the five-number summary 140
-
is a :
·
A
Central box spans the quartiles Q.
and Q3 =
120
.
-
line i n the the
·
A
box marks median .
M
100 -
extend from the to
·
ines box out the smallest
80 >
and
largest o b s e r va t i o n s .
cestacarce at ns
The variance s of a set of observations is the average
of the average of the squares of the deviations of the
obser vations from their mean .
In
symbols ,
the Variance
of n observations X, X ,,
. . . . n
is
sa =
x
-
x)" +
(x+ + x( + . . .
+ (xn + =)
M -
A
o in more compac t notation ,
5
x)
=
/Xe -
n =
1 ,
The Standard deviations is the square root
of the variance s s
nEn
=
R
*
-
:
IX .
, Constycur c
A density curve is a curve that
·
is
always on or above the horizont axis
·
has area exactly A u n d e r n e at h it .
A density curve describes the Overall
pattern of a distribution . The a re a under
TheUnweit
fall in that range
Standarc-igand-score CPS (fee Ge COMEINE OUS YElfiGBIES
# X is an observation from a distribution
that has mean M and Standard deviation ,
0
Discrete Variables :
between any two adjacent values (e .
9 ., 0
, 1
, ,
2
3 Children) ,
the standardized va l u e of x is
X -
M
z inter mediate possible
=
no va l u e s are .
O
A Standardized valve i s often called a
z- s core .
Continuous Variables :
In principle , between any two adjacent scale values ,
intermediate values are possible .
(e
. 9
.,
4 . 11 ,4
. 12 , 14 . 13)
ndependent and dependent Variables
Independent variable is the presumed cause in a cause -effect
EffeCt
:
Mit
cause
relation
;
in experiments ,
it is a factor that researchers man-
Independent
V aricible
·
Influences
*
Dependent
Variable
ipulate or systematically vary in order to assess i ts influence
Type of Technology Number of navigation
e r ro rs
On some behavior or o u tc o m e .
Stimulus intensity Influences Re ac t ion time
Dependent variable i s : the presumed effect in a cause-effect
self-esteem Effort expended at
a c h i eve m e n t tasks
relation in an experiment it is the benavior or outcome that
;
,
the re s e a rch e r measures to d e te r m i n e whether the indep-
endent variable has produced an effect .
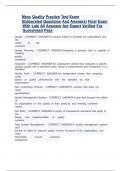
Mediator Variable
* a variable that provides acausal Link i n the
sequence between an independent Variable Independent Variable Mediator Variable Dependent Variable
⑱
cell
(while
phone use
Distraction n
⑱ Driving Per for mance
variable
driving) limpairea)
and a dependent . At te n t i o n
* VariCIDIE .
either
impair
don't
it
influence
much less .
driving per for mance or
least precise
Norminal :
Variable levels group objects into ↑
calegories , differ in kind , not i n degree
no rank
= ⑲
Die Chart Bar ,
Graph
Stemplots :
seperate each observation in to a
system
Order
political party affiliation Gender
Categorical
:
Le . g
,
...
And a leaf that are then plotted to display while main-
Ordinal : Variable group objects in to caregories ,
VCIVES gender
rCNK
) Alves represent caregories
Order
,
differ in Kind , but reflect rank order Impossible to put value in ↓
aining the original values of the Variable .
E
number number doesn't
;
· e
. g
.: SES a s l ow ,
middle , high ,
level of education represent smth ,
meaningful
*201
Interval :
numbers reflect actual amounts , equal 143 157159160164 162 1 6 3 1 75 1 75 1 7 7 183
distance between i n te r va l s O , is abitory difference 212 225
*
23 215 215 219 223
nas SOme ·
G
.
Histogram , stemplats
fa b s e n c e ·
·
Le . 9
:
Temperature grades ,
i
meani RG C 3
14
P
linear transformations allowed
are ladding
Constants or Multiplications) (lascore , grades
Quantit Cil
e
e
Raitio :
Interval scales , but zero point reflects
↳
true
numbers are meaningful
absence of property, scores can be
Related to values , can
be expressed in number
compared as ratios
e . number of questions correct on
sie
:
of the bars
g
re-
ex a m age i absence
Within
B the
corresponding
,
-
. c l a ss
.
add constants multiplications a l l owe d
So
& or are no rank order
↑
·
r
·
an identifier for each case
But NO Linear transformations >
participant number , name or
(Weight l e n g t h reaction t i m e ,
,
most precise ID
Examing Distrubutions
B
Symmetric distrubtion symmetric if the
A C
:
a is left
S
S
M
and right sides of the graph are approximately
longer
mir ror in ages of each Other
Right-sewed right :
side of the graph is much
than the left side
left-skewed :
left side of the graph is much longer
than the right side
X Variable
Describing Distrubutions with numbers
"x-bar" value
Saverage
Measuring ~
Center
·
:
:
differente
↓WO
M
"Center"
·
Median
:
LTv middle valve
·
Mode (Valve that appears most often)
Measuring spread
·
:
of
&Good measure
because
ra
calculation Square
↓
Quartiles C o re s SD
·
!
· Standard Deviation
only for quantative variables
M
Me DICH
5
:
e percentile
Mean cannot resist the influence of
extreme observations :
it's not a resistant
measure of center/presistant measure
-
is sometimes called 'robust measure
Median is more resistant than median
gefa
·
if adistribution is exactly symmetric
the meantmedian are exactly the same
-
· and
Deviation Standard
Deviation
n
Measuring Spread Quartile
:
Percentile percentage of scores lower
flects the
·
re S
Or equal to a par ticular score &
G
s =
n1(x- x) -
scores
=
2
=
:
6 6
25
36 ↳ s
= =
,
4
-
=
-
1
=M
V
V ,41
V
↓ Add all scores
:
number of scores
= 1
Q
5
55 21 ,
Qu median
=
3
Min
=
2
:
=
.
5
11 ,
,LECHU 2: par t
Standard normal distrubutions
Table entry for 2
lable entry
=
0
.7918
is always the area for z
=
. 81
Suppose obtained . of the 3
. The
0
.
a exam mean score
you
7
6 1 .
5
under the cur ve
on this exam is 5. and the SD is 1
.401 . The scores follow a
to the left of 2
distrubution What with
.
Normal the students
is
population of
M ·
,
&
·
a score of 6 .
7
or lower
?
WI
z-Score
·
(6 . 5)
-5 .
=12
:
7
=
0
,8
1, 451
* Table
:
Standard normal probabilities
·
A
(P(Z0 , 81) P(zx0;
, 81) =
,7910 · *
e
0
I I
50 ,7911 of 79 , %1 of the students obtained a .
1
7
, 0
6
3
or l owe r
z
=
0
. 81
Standard normal t a b l e Example
:
·How tall is a man that is taller than exactly 10% of men
aged 18-24 ?
Lo o k up the probability closest to 0
. 10 in the table
Mh
We need to "unstandardize" the z- s c o re to find the
·
·
mean
-
·
Observed va l ex :
x = =
x =
x +
2x5x
SD
* 70 + 1 -
1
, 28)x(2 ,B) =
X
&
&
-
&
70 + 1 5 8)
, 66 ,42
=
-
3
12 =
-
1
, 28
~
mecire & ·Manuel
,fet A
Moore Mccabe , , crais
cases :
objects described by a set of data
A Tail
Categorical Variable places of
.
a case in to one of ex t re m e values a distrubution
I
Variables :
characteristic of a case
s eve r a l or
calegories Mode major peak
.
groups .
a
Different cases have different values of the
A quantitative variable takes numerical value for Unimodal distribution with one
major peak
Variables label is special variable used
operations
a
which arithmetic adding
A
such as and distribution with
Biomodal
.
two p e a ks
in some data sets to uniquely identify different averaging make sense .
Trimodal distribution with t h re e p e a ks
cases .
C KartiCS .
and e
C Cnumber
Summary
to calculate the quartiles The five-number of set obser vations consists of
summary of
:
a
Arrange the obser vations in
increasing order and locale the observation the first third
-
smallest , quartile ,
the median, the
the median M in the ordered list of observations .
Quartile ,
and the largest observation ,
written in order from small-
2 The quartile obser- symbols the five-number
.
first Q1
is the median of the est to
largest .
In ,
summary is :
Va t i o n s w h os e positions in the ordered list are to the Minimum Qu M Q2 Maximum
left of the location of the Overall median
3 . The third quartile a,
is the median of the obser-
nterquartile range 2
The interquartile range IQR i s the distance between the first
Vations whose positions in the ordered list are to
and third quar tiles
:
IQR =
Q3-Q 1
& call an o b s e r va t i o n a suspected outlier if it falls more
the
right of the location of the Overall median than 5 X/ Q R
, below the
1
first quartile or a b ove the
third quartile .
This is called the 1 5x1QR
. Rule .
3 VI t also called box and whiskers piots
160-
-
A boxplot graph of the five-number summary 140
-
is a :
·
A
Central box spans the quartiles Q.
and Q3 =
120
.
-
line i n the the
·
A
box marks median .
M
100 -
extend from the to
·
ines box out the smallest
80 >
and
largest o b s e r va t i o n s .
cestacarce at ns
The variance s of a set of observations is the average
of the average of the squares of the deviations of the
obser vations from their mean .
In
symbols ,
the Variance
of n observations X, X ,,
. . . . n
is
sa =
x
-
x)" +
(x+ + x( + . . .
+ (xn + =)
M -
A
o in more compac t notation ,
5
x)
=
/Xe -
n =
1 ,
The Standard deviations is the square root
of the variance s s
nEn
=
R
*
-
:
IX .
, Constycur c
A density curve is a curve that
·
is
always on or above the horizont axis
·
has area exactly A u n d e r n e at h it .
A density curve describes the Overall
pattern of a distribution . The a re a under
TheUnweit
fall in that range
Standarc-igand-score CPS (fee Ge COMEINE OUS YElfiGBIES
# X is an observation from a distribution
that has mean M and Standard deviation ,
0
Discrete Variables :
between any two adjacent values (e .
9 ., 0
, 1
, ,
2
3 Children) ,
the standardized va l u e of x is
X -
M
z inter mediate possible
=
no va l u e s are .
O
A Standardized valve i s often called a
z- s core .
Continuous Variables :
In principle , between any two adjacent scale values ,
intermediate values are possible .
(e
. 9
.,
4 . 11 ,4
. 12 , 14 . 13)
ndependent and dependent Variables
Independent variable is the presumed cause in a cause -effect
EffeCt
:
Mit
cause
relation
;
in experiments ,
it is a factor that researchers man-
Independent
V aricible
·
Influences
*
Dependent
Variable
ipulate or systematically vary in order to assess i ts influence
Type of Technology Number of navigation
e r ro rs
On some behavior or o u tc o m e .
Stimulus intensity Influences Re ac t ion time
Dependent variable i s : the presumed effect in a cause-effect
self-esteem Effort expended at
a c h i eve m e n t tasks
relation in an experiment it is the benavior or outcome that
;
,
the re s e a rch e r measures to d e te r m i n e whether the indep-
endent variable has produced an effect .
Mediator Variable
* a variable that provides acausal Link i n the
sequence between an independent Variable Independent Variable Mediator Variable Dependent Variable
⑱
cell
(while
phone use
Distraction n
⑱ Driving Per for mance
variable
driving) limpairea)
and a dependent . At te n t i o n
* VariCIDIE .
either
impair
don't
it
influence
much less .
driving per for mance or