2025 OCR AS Level Physics A
H156/02 Depth in physics
Verified Question paper with Marking Scheme Attached
Oxford Cambridge and RSA
Wednesday 21 May 2025 – Afternoon
AS Level Physics A
H156/02 Depth in physics
Time allowed: 1 hour 30 minutes
You must have:
• the Data, Formulae and Relationships Booklet
• a ruler (cm/mm)
You can use:
• a scientific or graphical calculator
Please write clearly in black ink. Do not write in the barcodes.
Centre number Candidate number
First name(s)
Last name
INSTRUCTIONS
• Use black ink. You can use an HB pencil, but only for graphs and diagrams.
• Write your answer to each question in the space provided. If you need extra space use the lined
pages at the end of this booklet. The question numbers must be clearly shown.
• Answer all the questions.
• Where appropriate, your answer should be supported with working. Marks might be given
for using a correct method, even if your answer is wrong.
INFORMATION
• The total mark for this paper is 70.
• The marks for each question are shown in brackets [ ].
• Quality of extended response will be assessed in questions marked with an asterisk (*).
• This document has 24 pages.
© OCR 2025 [601/4742/8] OCR is an exempt Charity
DC (DE/FC) 358126/5 Turn over
, 2
Answer all the questions in this section.
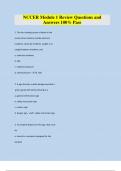
1 A high speed passenger train is travelling at a velocity of 54 m s–1.
The simplified graph shows the variation with time t of the velocity v of the train until it stops. At t = 0
the driver starts to think about applying the brakes.
60
50
40
v / m s–1 30
20
10
0
0 20 40 60 80 100 120 140
t/s
© OCR 2025
, 3
(a) Use the graph to determine the acceleration a of the train while the driver applies the brakes.
a = .....
–............................ m s –2
[1]
(b) Use the graph to determine the total stopping distance d of the train from t = 0.
d =............................................................... m [2]
(c) Suggest why the graph does not show the real motion of the train.
..........................................................................................................................................................
..........................................................................................................................................................
. .................................................................................................................................................................... [2]
© OCR 2025 Turn over
, 4
2
(a) A student has six similar metal spherical balls. To determine the mean mass of a ball, the student
measures the diameters of the balls.
The table shows the measurements.
Diameter / cm 0.565 0.562 0.555 0.561 0.562 0.556
The density of the metal is (8.9 ± 0.1) g cm–3.
(i) Show that the mean mass m of each of the balls is approximately 0.82 g.
[2]
(ii) Calculate the percentage uncertainty in m.
percentage uncertainty = ................................................................. % [2]
© OCR 2025
H156/02 Depth in physics
Verified Question paper with Marking Scheme Attached
Oxford Cambridge and RSA
Wednesday 21 May 2025 – Afternoon
AS Level Physics A
H156/02 Depth in physics
Time allowed: 1 hour 30 minutes
You must have:
• the Data, Formulae and Relationships Booklet
• a ruler (cm/mm)
You can use:
• a scientific or graphical calculator
Please write clearly in black ink. Do not write in the barcodes.
Centre number Candidate number
First name(s)
Last name
INSTRUCTIONS
• Use black ink. You can use an HB pencil, but only for graphs and diagrams.
• Write your answer to each question in the space provided. If you need extra space use the lined
pages at the end of this booklet. The question numbers must be clearly shown.
• Answer all the questions.
• Where appropriate, your answer should be supported with working. Marks might be given
for using a correct method, even if your answer is wrong.
INFORMATION
• The total mark for this paper is 70.
• The marks for each question are shown in brackets [ ].
• Quality of extended response will be assessed in questions marked with an asterisk (*).
• This document has 24 pages.
© OCR 2025 [601/4742/8] OCR is an exempt Charity
DC (DE/FC) 358126/5 Turn over
, 2
Answer all the questions in this section.
1 A high speed passenger train is travelling at a velocity of 54 m s–1.
The simplified graph shows the variation with time t of the velocity v of the train until it stops. At t = 0
the driver starts to think about applying the brakes.
60
50
40
v / m s–1 30
20
10
0
0 20 40 60 80 100 120 140
t/s
© OCR 2025
, 3
(a) Use the graph to determine the acceleration a of the train while the driver applies the brakes.
a = .....
–............................ m s –2
[1]
(b) Use the graph to determine the total stopping distance d of the train from t = 0.
d =............................................................... m [2]
(c) Suggest why the graph does not show the real motion of the train.
..........................................................................................................................................................
..........................................................................................................................................................
. .................................................................................................................................................................... [2]
© OCR 2025 Turn over
, 4
2
(a) A student has six similar metal spherical balls. To determine the mean mass of a ball, the student
measures the diameters of the balls.
The table shows the measurements.
Diameter / cm 0.565 0.562 0.555 0.561 0.562 0.556
The density of the metal is (8.9 ± 0.1) g cm–3.
(i) Show that the mean mass m of each of the balls is approximately 0.82 g.
[2]
(ii) Calculate the percentage uncertainty in m.
percentage uncertainty = ................................................................. % [2]
© OCR 2025