WEEK 1
(Clips 1,2,3) (Chapters 1-3)
Statistics: is the art and science of collecting, analyzing, presenting and interpreting data.
Statistics is a way to get information from data.
Population: larger group of elements in a particular study.
Sample: smaller group from the population.
Statistical analysis is applied to the sample to draw conclusions from
the population (statistical inference).
Data: facts and figures collected, analyzed and summarized for presentation and interpretation.
Data set/Database: All the data collected in a particular study.
Elements: are the entities on which data are collected.
Variable: is a characteristic of interest for the elements.
Scales of measurement
Quantitative data: require numeric values that
indicate how much or how many.
Categorical/ qualitative data: include labels or
names used to identify an attribute of each element.
● Nominal scale: data for a variable consist of labels or names used to identify an attribute of the element. Ex:
gender, nationality, religion, zip codes.
● Ordinal scale: data exhibit the properties of nominal data (labels or names) and the order or rank is meaningful. Ex:
clothes sizes, education levels, movie stars, a survey with a ranking from 1 to 5 from very unsatisfied to very
satisfied.
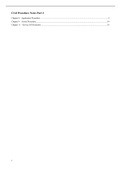
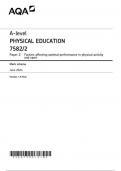
● Interval scale: data have the properties of ordinal data and the interval between values is expressed in terms of a
fixed unit of measure. Interval data are always numeric. Ex: temperature 10° to 11° is not the same as 40° to 41°
(see below table), or GMAT scores.
● Ratio scale: data have the properties of interval data and the ratio of two values is meaningful. True zero exists,
which means zero is a starting point. ex: the age difference between 89 and 90 is the same as 40 and 41, but 0 can
exist and has a meaning. Variables such as distance, height, weight and time.
,Types of data sets
● Cross-sectional data: are data collected at the same or approximately the same point in time. It is the most basic.
Ex: survey sent only once and measure several variables.
● Time series data: are data collected over several time periods. Ex: stock prices.
● Panel data: combination of both. It is the preferred method. Ex: send the same survey every year.
Data sources
● Primary data: New data collected by yourself. You adjust
the collection of data depending on what you need.
● Secondary data: Existing data collected for other purposes
in the past. It is cheaper and less time consuming but you
don't have control on the collection.
● You can combine the sources of data by collecting primary
data that matches the secondary data.
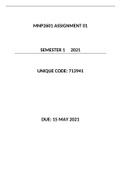
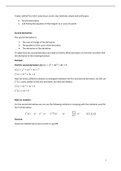
Statistics & The Empirical Cycle
There is a theory about X, and based on the theory, we come up
with a hypothesis, then we collect data and do observations, then
we do testing that translates in empirical findings and we develop a
theory.
Analytics
Analytics: scientific process of transforming data into insight for making better decisions.
Descriptive analytics: set of analytical techniques that describe what has happened in the past.
Ex: data queries, reports, descriptive statistics, data visualization and data dashboards.
Predictive analytics: analytical techniques that use models constructed from past data to predict the future or to assess the
impact of one variable on another. Ex: past data on sales of a product may be used to construct a mathematical model that
predicts future sales
Prescriptive analytics: set of analytical techniques
that yields the best course of action. Ex: Optimization models.
Big data: Larger and more complex data sets
Data mining: methods for developing useful decision-making information from large databases.
Statistical analysis
Descriptive statistics:
Organizing, summarizing, and presenting data by:
• Using graphical techniques
• Using numerical techniques
1. Tables and Figures
Categorical variables: Tables
• Frequency distribution shown in a table
• Absolute (numbers) & Relative (percentages) frequency
• Cumulative frequencies: only relevant if there is an order in the categories.
• Not too many categories. Otherwise: combine some categories.
• Small categories could be combined into “Other”.
,Categorical variables:Figures (graphs)
• Often in a bar chart: horizontal or vertical
• Order the bars from bigger to smaller.
• Can be with or without numbers (frequencies), but it can be useful to add at the end of the bar
• Pie charts are more difficult to interpret, used only for categorical variables where % is relevant (e.g. market shares; sum to
100%).
Numeric variables
• Frequency distribution shown in a table
• Absolute & Relative frequency.
• Cumulative frequencies (more relevant now).
• Often too many categories, so recoding is needed. Ex: Age recoded into Age Category.
• Not too many or too few groups (5 to 10 groups)
• If possible: equal distance between thresholds (umbrales). Ex: recode age in groups of every 10 years
• Alternatively, aim at groups of similar size.
Concepts:
Class limits (categories): must be chosen so that each data item belongs to one and only one class.
• The lower class limit identifies the smallest possible data value assigned to the class.
• The upper class limit identifies the largest possible data value assigned to the class.
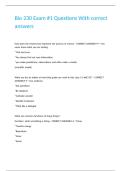
Class midpoint: is the value halfway between the lower and upper class limits.
Ex: the five class midpoints are 12, 17, 22, 27 and 32.
Histogram: is a chart showing quantitative data previously summarized in a frequency distribution.
Cumulative frequency distribution: uses the number of classes, class widths and class limits adopted for the frequency
distribution. Rather than showing the frequency of each class, it shows the number of data items with values less than or
equal to the upper class limit of each class.
Dot plot: A horizontal axis shows the range of values for the observations,
each data value is represented by a dot placed above the axis.
Stem-and-leaf display: shows both the rank order and shape of a data set
simultaneously
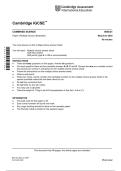
Cross tabulation: is a tabular summary of data for two variables. “Crosstabs” in SPSS.
Ex: Cross tabulation of quality rating and meal price for 300 restaurants
Simpson’s paradox: when a cross tabulation shows a relationship between two variables after being aggregated across a
third variable, but if we look at the non-aggregated data, the conclusion can be completely reversed.
Clustered bar charts and stacked bar charts: used to show the joint distribution of two categorical variables, and to help
understand the relationship between them.
, Scatter diagram: graphical presentation of the relationship between 2 quantitative variables.
the predictor on X and the outcome on Y.
Trend line: is a line that provides an approximation of the relationship.
Summary
2. Numerical measures
Properties of distributions I
Measures of central tendency (location): how high or low are the numbers on the distribution
• Mean: The most commonly used measure of central location for a data set.
Used for interval and ratio variables only.
• Weighted mean: the mean is computed by giving each observation a weight that reflects its importance.
• Geometric mean: calculated by finding the product of all n data items, then taking the nth root of this product.
• Median: is the value in the middle when the data are arranged in ascending order (smallest value to largest value).
When even number of cases: average of the two middle values. Used for ordinal and higher measurement level
• Mode: is the value that occurs with the greatest frequency. Used only for nominal variables.
Measures of variability: how much difference is across observations.
• Minimum & Maximum: used for ordinal and higher measurement level
•.Range: Values observed in the data: Maximum – Minimum. Only for variables with interval or ratio measurement level.
• Interquartile range: difference between the third and the first quartile (Q3 - Q1). Range for the middle 50% of the data.
• Variance: measure that uses all the data values, and is based on the difference between each data value and the mean.
This difference is called a deviation about the mean: written for a population and for sample data
It is also the square of standard deviation.
Only for variables with interval or ratio measurement level.
• Standard deviation: the positive square root of the variance.
Only for variables with interval or ratio measurement level
• Coefficient of variation: indicates how large the standard deviation is relative to the mean.
How much variation in the sample, relative to the average of the variable.
Properties of distributions II
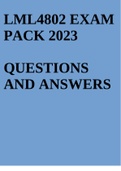
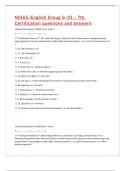
Distributional shape:
• Symmetric (skewness = 0) versus skewed (asymmetric)
• Only for variables with interval or ratio measurement level
• Positive skew, Symmetrical distribution, or Negative skew
(Clips 1,2,3) (Chapters 1-3)
Statistics: is the art and science of collecting, analyzing, presenting and interpreting data.
Statistics is a way to get information from data.
Population: larger group of elements in a particular study.
Sample: smaller group from the population.
Statistical analysis is applied to the sample to draw conclusions from
the population (statistical inference).
Data: facts and figures collected, analyzed and summarized for presentation and interpretation.
Data set/Database: All the data collected in a particular study.
Elements: are the entities on which data are collected.
Variable: is a characteristic of interest for the elements.
Scales of measurement
Quantitative data: require numeric values that
indicate how much or how many.
Categorical/ qualitative data: include labels or
names used to identify an attribute of each element.
● Nominal scale: data for a variable consist of labels or names used to identify an attribute of the element. Ex:
gender, nationality, religion, zip codes.
● Ordinal scale: data exhibit the properties of nominal data (labels or names) and the order or rank is meaningful. Ex:
clothes sizes, education levels, movie stars, a survey with a ranking from 1 to 5 from very unsatisfied to very
satisfied.
● Interval scale: data have the properties of ordinal data and the interval between values is expressed in terms of a
fixed unit of measure. Interval data are always numeric. Ex: temperature 10° to 11° is not the same as 40° to 41°
(see below table), or GMAT scores.
● Ratio scale: data have the properties of interval data and the ratio of two values is meaningful. True zero exists,
which means zero is a starting point. ex: the age difference between 89 and 90 is the same as 40 and 41, but 0 can
exist and has a meaning. Variables such as distance, height, weight and time.
,Types of data sets
● Cross-sectional data: are data collected at the same or approximately the same point in time. It is the most basic.
Ex: survey sent only once and measure several variables.
● Time series data: are data collected over several time periods. Ex: stock prices.
● Panel data: combination of both. It is the preferred method. Ex: send the same survey every year.
Data sources
● Primary data: New data collected by yourself. You adjust
the collection of data depending on what you need.
● Secondary data: Existing data collected for other purposes
in the past. It is cheaper and less time consuming but you
don't have control on the collection.
● You can combine the sources of data by collecting primary
data that matches the secondary data.
Statistics & The Empirical Cycle
There is a theory about X, and based on the theory, we come up
with a hypothesis, then we collect data and do observations, then
we do testing that translates in empirical findings and we develop a
theory.
Analytics
Analytics: scientific process of transforming data into insight for making better decisions.
Descriptive analytics: set of analytical techniques that describe what has happened in the past.
Ex: data queries, reports, descriptive statistics, data visualization and data dashboards.
Predictive analytics: analytical techniques that use models constructed from past data to predict the future or to assess the
impact of one variable on another. Ex: past data on sales of a product may be used to construct a mathematical model that
predicts future sales
Prescriptive analytics: set of analytical techniques
that yields the best course of action. Ex: Optimization models.
Big data: Larger and more complex data sets
Data mining: methods for developing useful decision-making information from large databases.
Statistical analysis
Descriptive statistics:
Organizing, summarizing, and presenting data by:
• Using graphical techniques
• Using numerical techniques
1. Tables and Figures
Categorical variables: Tables
• Frequency distribution shown in a table
• Absolute (numbers) & Relative (percentages) frequency
• Cumulative frequencies: only relevant if there is an order in the categories.
• Not too many categories. Otherwise: combine some categories.
• Small categories could be combined into “Other”.
,Categorical variables:Figures (graphs)
• Often in a bar chart: horizontal or vertical
• Order the bars from bigger to smaller.
• Can be with or without numbers (frequencies), but it can be useful to add at the end of the bar
• Pie charts are more difficult to interpret, used only for categorical variables where % is relevant (e.g. market shares; sum to
100%).
Numeric variables
• Frequency distribution shown in a table
• Absolute & Relative frequency.
• Cumulative frequencies (more relevant now).
• Often too many categories, so recoding is needed. Ex: Age recoded into Age Category.
• Not too many or too few groups (5 to 10 groups)
• If possible: equal distance between thresholds (umbrales). Ex: recode age in groups of every 10 years
• Alternatively, aim at groups of similar size.
Concepts:
Class limits (categories): must be chosen so that each data item belongs to one and only one class.
• The lower class limit identifies the smallest possible data value assigned to the class.
• The upper class limit identifies the largest possible data value assigned to the class.
Class midpoint: is the value halfway between the lower and upper class limits.
Ex: the five class midpoints are 12, 17, 22, 27 and 32.
Histogram: is a chart showing quantitative data previously summarized in a frequency distribution.
Cumulative frequency distribution: uses the number of classes, class widths and class limits adopted for the frequency
distribution. Rather than showing the frequency of each class, it shows the number of data items with values less than or
equal to the upper class limit of each class.
Dot plot: A horizontal axis shows the range of values for the observations,
each data value is represented by a dot placed above the axis.
Stem-and-leaf display: shows both the rank order and shape of a data set
simultaneously
Cross tabulation: is a tabular summary of data for two variables. “Crosstabs” in SPSS.
Ex: Cross tabulation of quality rating and meal price for 300 restaurants
Simpson’s paradox: when a cross tabulation shows a relationship between two variables after being aggregated across a
third variable, but if we look at the non-aggregated data, the conclusion can be completely reversed.
Clustered bar charts and stacked bar charts: used to show the joint distribution of two categorical variables, and to help
understand the relationship between them.
, Scatter diagram: graphical presentation of the relationship between 2 quantitative variables.
the predictor on X and the outcome on Y.
Trend line: is a line that provides an approximation of the relationship.
Summary
2. Numerical measures
Properties of distributions I
Measures of central tendency (location): how high or low are the numbers on the distribution
• Mean: The most commonly used measure of central location for a data set.
Used for interval and ratio variables only.
• Weighted mean: the mean is computed by giving each observation a weight that reflects its importance.
• Geometric mean: calculated by finding the product of all n data items, then taking the nth root of this product.
• Median: is the value in the middle when the data are arranged in ascending order (smallest value to largest value).
When even number of cases: average of the two middle values. Used for ordinal and higher measurement level
• Mode: is the value that occurs with the greatest frequency. Used only for nominal variables.
Measures of variability: how much difference is across observations.
• Minimum & Maximum: used for ordinal and higher measurement level
•.Range: Values observed in the data: Maximum – Minimum. Only for variables with interval or ratio measurement level.
• Interquartile range: difference between the third and the first quartile (Q3 - Q1). Range for the middle 50% of the data.
• Variance: measure that uses all the data values, and is based on the difference between each data value and the mean.
This difference is called a deviation about the mean: written for a population and for sample data
It is also the square of standard deviation.
Only for variables with interval or ratio measurement level.
• Standard deviation: the positive square root of the variance.
Only for variables with interval or ratio measurement level
• Coefficient of variation: indicates how large the standard deviation is relative to the mean.
How much variation in the sample, relative to the average of the variable.
Properties of distributions II
Distributional shape:
• Symmetric (skewness = 0) versus skewed (asymmetric)
• Only for variables with interval or ratio measurement level
• Positive skew, Symmetrical distribution, or Negative skew