RM | Unit 230 - ANOVA, F test, and Sums of squares + Unit 235 - F statistic, F distribution, and
degrees of freedom
Book: Analysing data using linear models
Chapter 6: 6.8, 6.9, 6.10, 6.12
Chapter 6.8: Analysis of Variance
Since we know that applying a linear model to a categorical independent variable is the same as
modelling group means, we can test the null-hypothesis that all group means are equal in the population.
Let µt1 be the mean yield in the population of the treatment 1 group, µt2 be the mean yield in the
treatment 2 group, and µc be the mean yield in the control group. Then we can specify the null-hypothesis
using symbols in the following way: H0 : µt1 = µt2 = µc.
If all group means are equal in the
population, then all population slopes would be 0.
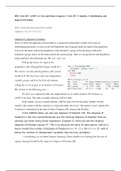
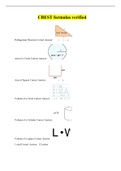
We want to test this null-hypothesis with a linear
model in R. We then have only one independent
variable, group, and if we let R do the dummy
coding for us, R can give us an Analysis of Variance.
We do that in the following way: →
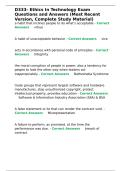
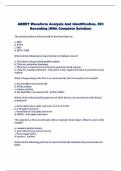
We don’t see a regression table, but output based on a so-called Analysis Of VAriance, or
ANOVA for short. This table is usually called an ANOVA table.
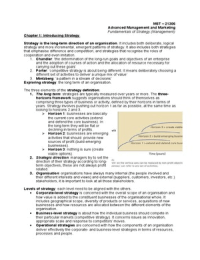
In the output, you see a column statistic, with the value 4.85 for the group variable. It looks
similar to the column with the t-statistic in a regression table, but it isn’t. The statistic is an F-statistic.The
F-statistic is constructed on the basis of Sum of Squares (SS, sumsq in the R table).
In the ANOVA table, we also see degrees of freedom (df). The degrees of
freedom in the row named Residuals are the residual degrees of freedom that we
already use when doing linear regression (Chapter 5). Here we see the residual
degrees of freedom equals 27. This is so because we have 30 data points, and for a
linear model the number of degrees of freedom is n− K −1 = 30−2−1 = 27, with K
being the number of independent variables (two dummy variables).
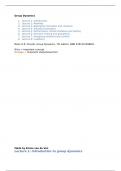
→ Continuing, we see Mean Squares (meansq). These numbers are nothing but the sum of
squares (sumsq) divided by the respective degrees of freedom (df).
degrees of freedom
Book: Analysing data using linear models
Chapter 6: 6.8, 6.9, 6.10, 6.12
Chapter 6.8: Analysis of Variance
Since we know that applying a linear model to a categorical independent variable is the same as
modelling group means, we can test the null-hypothesis that all group means are equal in the population.
Let µt1 be the mean yield in the population of the treatment 1 group, µt2 be the mean yield in the
treatment 2 group, and µc be the mean yield in the control group. Then we can specify the null-hypothesis
using symbols in the following way: H0 : µt1 = µt2 = µc.
If all group means are equal in the
population, then all population slopes would be 0.
We want to test this null-hypothesis with a linear
model in R. We then have only one independent
variable, group, and if we let R do the dummy
coding for us, R can give us an Analysis of Variance.
We do that in the following way: →
We don’t see a regression table, but output based on a so-called Analysis Of VAriance, or
ANOVA for short. This table is usually called an ANOVA table.
In the output, you see a column statistic, with the value 4.85 for the group variable. It looks
similar to the column with the t-statistic in a regression table, but it isn’t. The statistic is an F-statistic.The
F-statistic is constructed on the basis of Sum of Squares (SS, sumsq in the R table).
In the ANOVA table, we also see degrees of freedom (df). The degrees of
freedom in the row named Residuals are the residual degrees of freedom that we
already use when doing linear regression (Chapter 5). Here we see the residual
degrees of freedom equals 27. This is so because we have 30 data points, and for a
linear model the number of degrees of freedom is n− K −1 = 30−2−1 = 27, with K
being the number of independent variables (two dummy variables).
→ Continuing, we see Mean Squares (meansq). These numbers are nothing but the sum of
squares (sumsq) divided by the respective degrees of freedom (df).