INTRODUCTION TO RESEARCH IN MARKETING
Index
Lecture 1 – Introduction, data exploration & visualization ..............................................................................3
Statistical tests ....................................................................................................................................................3
Multivariate analysis ...........................................................................................................................................3
Review: measurement, sampling and statistical testing.....................................................................................3
Review: sampling ................................................................................................................................................4
Review: measurement scales (ending up in measurement error) ......................................................................5
Summated scales ................................................................................................................................................6
Measurement .....................................................................................................................................................6
Review: statistical error (hypothesis testing) .....................................................................................................6
Statistical testing.................................................................................................................................................7
Exploratory data analysis ....................................................................................................................................7
Visualization ........................................................................................................................................................8
Detect outliers ....................................................................................................................................................8
Examining missing data ......................................................................................................................................9
Lecture 2: ANOVA ...........................................................................................................................................9
Step 1: Defining the objectives ...........................................................................................................................9
Step 2: Designing the ANOVA ...........................................................................................................................10
Step 3: Checking assumptions ..........................................................................................................................12
Step 4: Estimating the model ............................................................................................................................14
Step 5: Interpreting the results .........................................................................................................................15
Step 6: Validating the outcomes .......................................................................................................................19
Step 7: Using the results ...................................................................................................................................19
Lecture 3: Cluster Analysis ............................................................................................................................19
Step 1: Defining objectives Cluster Analysis .....................................................................................................19
Step 2: Designing the study ..............................................................................................................................20
Step 3: Checking assumptions ..........................................................................................................................22
Step 4: Deriving the clusters .............................................................................................................................22
Step 5: Interpreting the clusters .......................................................................................................................26
Step 6: Validating and profiling the clusters .....................................................................................................27
Step 7: Using the results ...................................................................................................................................27
,Lecture 4: Factor Analysis..............................................................................................................................27
Step 1: Defining the objectives .........................................................................................................................27
Step 2: Designing the study ..............................................................................................................................29
Step 3: Assumptions .........................................................................................................................................30
Step 4: Deriving the factors ..............................................................................................................................30
Step 5: Interpreting factors...............................................................................................................................32
Step 6: Validating the results ............................................................................................................................34
Step 7: Using the results ...................................................................................................................................35
Lecture 5: Logistic regression (logit) ..............................................................................................................36
Step 1: Defining the objectives .........................................................................................................................36
Step 2: Designing the study ..............................................................................................................................37
Step 3: Checking assumptions ..........................................................................................................................38
Step 5: Interpreting the outcomes....................................................................................................................43
Step 6: Validating the results ............................................................................................................................46
Step 7: Using the results ...................................................................................................................................46
Lecture 6: Conjoint analysis...........................................................................................................................46
Step 1: Defining the objectives .........................................................................................................................46
Step 2: Designing the study ..............................................................................................................................47
Step 3: Checking assumptions ..........................................................................................................................51
Step 4: Estimating the model and assessing fit.................................................................................................51
Step 5: Interpreting the outcomes....................................................................................................................53
Step 6: Validating the results ............................................................................................................................58
Step 7: Using the results ...................................................................................................................................58
Lecture 7: Multi-dimensional scaling .............................................................................................................58
Step 1: Defining the objectives .........................................................................................................................58
Step 2: Designing the study ..............................................................................................................................59
Step 3: Checking the assumptions ....................................................................................................................61
Step 4: Deriving a perceptual map....................................................................................................................61
Step 5: Interpreting the map ............................................................................................................................63
Step 6: Validating the results ............................................................................................................................64
Step 7: Using the results ...................................................................................................................................64
2
, Lecture 1 – Introduction, data exploration & visualization
Lecture 1 – Introduction, data exploration & visualization
Statistical tests
Statistical test exists to support strategic and tactical decisions like segmentation, targeting, positioning,
etc. This is important because almost every real-life marketing problem requires statistical analysis.
- What types of shoppers can we distinguish and how can we optimally market our products to
them?
- What is our brand image relative to our competitors?
Multivariate analysis
Refers to all statistical methods that analyze multiple measurements on each object under investigation:
- Dependence techniques
One or more variables can be identified as dependent variables and the remaining as
independent variables. The choice of dependence technique depends on the number of
dependent variables. You are looking for cause and effect relationships.
à Logistic regression, conjoint analysis
- Interdependence techniques
For a large number of measures.
à Factor analysis, cluster analysis
Review: measurement, sampling and statistical testing
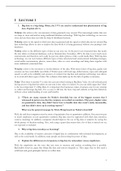
Total error framework
What you don’t observe when you are collecting data are the errors. This could be:
- Sampling error: who I ask
- Measurement error: how I ask
- Statistical error: how I analyze
If you mess up any of these, your results will be biased and your recommendations will be wrong.
Example
So, in the treatment group you 6.5 and there is an error 0f 1.5. So therefore, you have a control group.
It is very important to avoid errors, because otherwise you will give your manager the wrong advice
based on your data which includes errors.
3
, Lecture 1 – Introduction, data exploration & visualization
Review: sampling Sampling error: a biased sampling
Problem
Smartphone adoption means everyone screens their calls.
The sample of respondents differ (significantly) from the population.
à Non-response error
To what extent is that 6% who responds different from the population?
In practice
Basically, every survey:
- Sampling
- Adjust using post-stratification weights
Make your sample closer to your population by using post-stratification
weights.
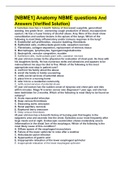
Male Female
Let’s say your population is 50% female, but your sample is
80% female. So your sample is biased because you have more n1 = 20 n2 = 80
female in your sample than in the population. 𝑋"! = 4.2 𝑋"" = 3.4
You’re interested in measuring some quantity like: ‘how likely are you to buy brand Z (on a 1-5 scale, 5
= most interest, 1 = least)? The males give an average of 4.2 on buying this brand. And females on
average 3.4.
A simple average will underestimate males, who in this case like brand Z more than females.
(0.2 x 0.4) + (0.8 x 3.4) = 3.56
But our sample is biased, so this is wrong. We need to debias the sample. In the sample ,
whereas in the population .
Then the weighted average will be closer:
4
, Lecture 1 – Introduction, data exploration & visualization
Review: measurement scales (ending up in measurement error)
If you don’t use the right scale, you can’t do the right statistical techniques. When we talk about
measurement scales, we talk about:
- Non-metric scales
Nominal (categorical) and ordinal. These outcomes can be categorical (labels) or directional –
can measure only the direction of the response (yes/no).
- Metric (continuous scales)
Interval or ratio. In contrast, when scales are continuous they don’t measure direction or
classification, but the intensity as well (strongly agree or somewhat agree).
Nominal scale
Number serves only as label or tag for identifying or classifying objects in mutually exclusive (= it is one
number, but not another) and collectively exhaustive (= at least one) categories. It has no meaning.
Example: SNR, gender. The SNR can be another number, but that makes no differences. We all have a
SNR, we can’t have no SNR (= collectively exhaustive), but we can’t have multiple student numbers (=
mutually exclusive).
Ordinal scale
Numbers are assigned to objects to indicate the relative positions of some characteristics of objects,
but not the magnitude of difference between them. These numbers have a meaning, but still the
difference between those numbers tell us nothing (education level).
Example: preference for brands or any other ranking. Ranking Apple, Samsung and Blackberry. I know
that Apple is more preferred than Samsung, but I don’t know by how much. The difference can be very
close but also very large. We don’t know that; it only gives a ranking.
Interval scale
Numbers are assigned to objects to indicate the relative positions of some characteristics of objects
with differences between objects being comparable; no absolute zero point.
Example: Likert scale, satisfaction scale, temperature Fahrenheit/Celsius (0 Celsius is the freezing point
of water, so it is arbitrary). When we ask people which telephone brand, they like the most; Apple or
Samsung. The outcome is Apple with a 4.2 and Samsung with a 3.6. We than know that Apple is more
preferred, but we also know by how much.
Ratio scale
The most precise scale with an absolute zero point. Has all the advantages of other scales.
Example: weight, height, age, income, temperature Kelvin
Why is this important to know?
Getting the units right, the right statistical technique depends on what scale is used (metric vs non-
metric). It makes no sense to calculate the mean of a nominal or ordinal scaled variable. We don’t want
to know what the average SNR of the class is.
Statistical programs make a big deal of asking you whether the variable is: nominal, ordinal or scale
(interval and ratio). If you do not what scale the variable is measured on, the program might infer that
for you and might select a particular technique which is wrong. If you do not tell SPSS that the variable
SNR is nominal, it is possible that SPSS uses the average of SNR in some techniques, which is wrong.
5
Index
Lecture 1 – Introduction, data exploration & visualization ..............................................................................3
Statistical tests ....................................................................................................................................................3
Multivariate analysis ...........................................................................................................................................3
Review: measurement, sampling and statistical testing.....................................................................................3
Review: sampling ................................................................................................................................................4
Review: measurement scales (ending up in measurement error) ......................................................................5
Summated scales ................................................................................................................................................6
Measurement .....................................................................................................................................................6
Review: statistical error (hypothesis testing) .....................................................................................................6
Statistical testing.................................................................................................................................................7
Exploratory data analysis ....................................................................................................................................7
Visualization ........................................................................................................................................................8
Detect outliers ....................................................................................................................................................8
Examining missing data ......................................................................................................................................9
Lecture 2: ANOVA ...........................................................................................................................................9
Step 1: Defining the objectives ...........................................................................................................................9
Step 2: Designing the ANOVA ...........................................................................................................................10
Step 3: Checking assumptions ..........................................................................................................................12
Step 4: Estimating the model ............................................................................................................................14
Step 5: Interpreting the results .........................................................................................................................15
Step 6: Validating the outcomes .......................................................................................................................19
Step 7: Using the results ...................................................................................................................................19
Lecture 3: Cluster Analysis ............................................................................................................................19
Step 1: Defining objectives Cluster Analysis .....................................................................................................19
Step 2: Designing the study ..............................................................................................................................20
Step 3: Checking assumptions ..........................................................................................................................22
Step 4: Deriving the clusters .............................................................................................................................22
Step 5: Interpreting the clusters .......................................................................................................................26
Step 6: Validating and profiling the clusters .....................................................................................................27
Step 7: Using the results ...................................................................................................................................27
,Lecture 4: Factor Analysis..............................................................................................................................27
Step 1: Defining the objectives .........................................................................................................................27
Step 2: Designing the study ..............................................................................................................................29
Step 3: Assumptions .........................................................................................................................................30
Step 4: Deriving the factors ..............................................................................................................................30
Step 5: Interpreting factors...............................................................................................................................32
Step 6: Validating the results ............................................................................................................................34
Step 7: Using the results ...................................................................................................................................35
Lecture 5: Logistic regression (logit) ..............................................................................................................36
Step 1: Defining the objectives .........................................................................................................................36
Step 2: Designing the study ..............................................................................................................................37
Step 3: Checking assumptions ..........................................................................................................................38
Step 5: Interpreting the outcomes....................................................................................................................43
Step 6: Validating the results ............................................................................................................................46
Step 7: Using the results ...................................................................................................................................46
Lecture 6: Conjoint analysis...........................................................................................................................46
Step 1: Defining the objectives .........................................................................................................................46
Step 2: Designing the study ..............................................................................................................................47
Step 3: Checking assumptions ..........................................................................................................................51
Step 4: Estimating the model and assessing fit.................................................................................................51
Step 5: Interpreting the outcomes....................................................................................................................53
Step 6: Validating the results ............................................................................................................................58
Step 7: Using the results ...................................................................................................................................58
Lecture 7: Multi-dimensional scaling .............................................................................................................58
Step 1: Defining the objectives .........................................................................................................................58
Step 2: Designing the study ..............................................................................................................................59
Step 3: Checking the assumptions ....................................................................................................................61
Step 4: Deriving a perceptual map....................................................................................................................61
Step 5: Interpreting the map ............................................................................................................................63
Step 6: Validating the results ............................................................................................................................64
Step 7: Using the results ...................................................................................................................................64
2
, Lecture 1 – Introduction, data exploration & visualization
Lecture 1 – Introduction, data exploration & visualization
Statistical tests
Statistical test exists to support strategic and tactical decisions like segmentation, targeting, positioning,
etc. This is important because almost every real-life marketing problem requires statistical analysis.
- What types of shoppers can we distinguish and how can we optimally market our products to
them?
- What is our brand image relative to our competitors?
Multivariate analysis
Refers to all statistical methods that analyze multiple measurements on each object under investigation:
- Dependence techniques
One or more variables can be identified as dependent variables and the remaining as
independent variables. The choice of dependence technique depends on the number of
dependent variables. You are looking for cause and effect relationships.
à Logistic regression, conjoint analysis
- Interdependence techniques
For a large number of measures.
à Factor analysis, cluster analysis
Review: measurement, sampling and statistical testing
Total error framework
What you don’t observe when you are collecting data are the errors. This could be:
- Sampling error: who I ask
- Measurement error: how I ask
- Statistical error: how I analyze
If you mess up any of these, your results will be biased and your recommendations will be wrong.
Example
So, in the treatment group you 6.5 and there is an error 0f 1.5. So therefore, you have a control group.
It is very important to avoid errors, because otherwise you will give your manager the wrong advice
based on your data which includes errors.
3
, Lecture 1 – Introduction, data exploration & visualization
Review: sampling Sampling error: a biased sampling
Problem
Smartphone adoption means everyone screens their calls.
The sample of respondents differ (significantly) from the population.
à Non-response error
To what extent is that 6% who responds different from the population?
In practice
Basically, every survey:
- Sampling
- Adjust using post-stratification weights
Make your sample closer to your population by using post-stratification
weights.
Male Female
Let’s say your population is 50% female, but your sample is
80% female. So your sample is biased because you have more n1 = 20 n2 = 80
female in your sample than in the population. 𝑋"! = 4.2 𝑋"" = 3.4
You’re interested in measuring some quantity like: ‘how likely are you to buy brand Z (on a 1-5 scale, 5
= most interest, 1 = least)? The males give an average of 4.2 on buying this brand. And females on
average 3.4.
A simple average will underestimate males, who in this case like brand Z more than females.
(0.2 x 0.4) + (0.8 x 3.4) = 3.56
But our sample is biased, so this is wrong. We need to debias the sample. In the sample ,
whereas in the population .
Then the weighted average will be closer:
4
, Lecture 1 – Introduction, data exploration & visualization
Review: measurement scales (ending up in measurement error)
If you don’t use the right scale, you can’t do the right statistical techniques. When we talk about
measurement scales, we talk about:
- Non-metric scales
Nominal (categorical) and ordinal. These outcomes can be categorical (labels) or directional –
can measure only the direction of the response (yes/no).
- Metric (continuous scales)
Interval or ratio. In contrast, when scales are continuous they don’t measure direction or
classification, but the intensity as well (strongly agree or somewhat agree).
Nominal scale
Number serves only as label or tag for identifying or classifying objects in mutually exclusive (= it is one
number, but not another) and collectively exhaustive (= at least one) categories. It has no meaning.
Example: SNR, gender. The SNR can be another number, but that makes no differences. We all have a
SNR, we can’t have no SNR (= collectively exhaustive), but we can’t have multiple student numbers (=
mutually exclusive).
Ordinal scale
Numbers are assigned to objects to indicate the relative positions of some characteristics of objects,
but not the magnitude of difference between them. These numbers have a meaning, but still the
difference between those numbers tell us nothing (education level).
Example: preference for brands or any other ranking. Ranking Apple, Samsung and Blackberry. I know
that Apple is more preferred than Samsung, but I don’t know by how much. The difference can be very
close but also very large. We don’t know that; it only gives a ranking.
Interval scale
Numbers are assigned to objects to indicate the relative positions of some characteristics of objects
with differences between objects being comparable; no absolute zero point.
Example: Likert scale, satisfaction scale, temperature Fahrenheit/Celsius (0 Celsius is the freezing point
of water, so it is arbitrary). When we ask people which telephone brand, they like the most; Apple or
Samsung. The outcome is Apple with a 4.2 and Samsung with a 3.6. We than know that Apple is more
preferred, but we also know by how much.
Ratio scale
The most precise scale with an absolute zero point. Has all the advantages of other scales.
Example: weight, height, age, income, temperature Kelvin
Why is this important to know?
Getting the units right, the right statistical technique depends on what scale is used (metric vs non-
metric). It makes no sense to calculate the mean of a nominal or ordinal scaled variable. We don’t want
to know what the average SNR of the class is.
Statistical programs make a big deal of asking you whether the variable is: nominal, ordinal or scale
(interval and ratio). If you do not what scale the variable is measured on, the program might infer that
for you and might select a particular technique which is wrong. If you do not tell SPSS that the variable
SNR is nominal, it is possible that SPSS uses the average of SNR in some techniques, which is wrong.
5