QuantitativeData Analysis 2
Week 1
, 1
Topic PrincipalComponentAnalysis
PrincipalcomponentanalysisPCA
Simplifiercomplexdata
bytransformingthedataintofewerdinemion
Identifierclusters variables
of
PCAisusedwhendata is very Too
manyvariablesconfusedaboutthe ofthevariables
structure
So we prepareraw databeforefurtheranalysis toconceptualoverlap
variablesandprovidingstructures
Byreducingthe number
of
PCAisused
bytransformingvariableintocomponents
therecomponenteare uncorrelatedtoeach
other
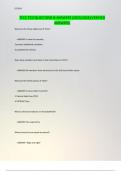
Intherawdatacomponentsare latentwhichneam
theyarenotpresentyet
component 2
B2
iii tearing
So inthecomponent1 are all variablerelated toextraversion
Thisiscalledtheorganizing
ofvariable FactoranalyinandPCA
ForthiscoursePCAis usedin an exploratory Not the same
way
ThePCAprocedure
1Initialcheck inthedatamitableforPCA
rotatiiterretation
2MainAnalyn Componentextractionand
3followupAnalyinCreatingnewrunnaryvariables
Initialcheck datarequirementsforPCA
Quantitativevariable Intervalescaleandratioscale
Strongcorrelationamongstvariables 0,30
Largenumberofobservation whenmorethan10 thenumber variables
of
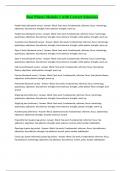
Thecomponentsarecalculatedfromco variancecorrelationbetweenthevariable
Component 3variable bevariable byvariable byvariable
, Thereare thevariables11inthis case
butthecontentoverlapeFromthiswe
wanttocreatecomponents
Cause we are analysing raw data
Include all data
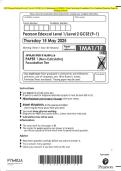
Nowwewanttoanalyse
thisraw data
wewanttoseduce
thenumberofvariables
Now receive correlation
a
you
matrixWiththismatrixwe
cancheckthe
firsttwoinitialcheck
Check1 YoualsoreceivetheKMOand
Inthesamplerisesufficient
AKAisthe
couplerisemore Bartlett'stest 2
than10thevariable
10 11 111
couplerise 114 more than111 Pvalue
sufficient
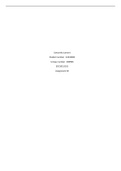
check3 TheKaiserMeyerIlkintest
Check2 Aretheitemcorrelated Meaner thereis a
if
Howtobeabove
0,3 on check4 Barlett'stest diffusedpaterninite
thismeantherearemany HoMatrix Identity the
matrix correlationbetween
correlation Negativeisalsookay Hy VariablesarecorrelatedVariableor a compact
to
WewanttorejectHo patternwithitarese
whichiswhenPvalue correlation
isbelow0,05 Ifbetweenasand1 PCA
Week 1
, 1
Topic PrincipalComponentAnalysis
PrincipalcomponentanalysisPCA
Simplifiercomplexdata
bytransformingthedataintofewerdinemion
Identifierclusters variables
of
PCAisusedwhendata is very Too
manyvariablesconfusedaboutthe ofthevariables
structure
So we prepareraw databeforefurtheranalysis toconceptualoverlap
variablesandprovidingstructures
Byreducingthe number
of
PCAisused
bytransformingvariableintocomponents
therecomponenteare uncorrelatedtoeach
other
Intherawdatacomponentsare latentwhichneam
theyarenotpresentyet
component 2
B2
iii tearing
So inthecomponent1 are all variablerelated toextraversion
Thisiscalledtheorganizing
ofvariable FactoranalyinandPCA
ForthiscoursePCAis usedin an exploratory Not the same
way
ThePCAprocedure
1Initialcheck inthedatamitableforPCA
rotatiiterretation
2MainAnalyn Componentextractionand
3followupAnalyinCreatingnewrunnaryvariables
Initialcheck datarequirementsforPCA
Quantitativevariable Intervalescaleandratioscale
Strongcorrelationamongstvariables 0,30
Largenumberofobservation whenmorethan10 thenumber variables
of
Thecomponentsarecalculatedfromco variancecorrelationbetweenthevariable
Component 3variable bevariable byvariable byvariable
, Thereare thevariables11inthis case
butthecontentoverlapeFromthiswe
wanttocreatecomponents
Cause we are analysing raw data
Include all data
Nowwewanttoanalyse
thisraw data
wewanttoseduce
thenumberofvariables
Now receive correlation
a
you
matrixWiththismatrixwe
cancheckthe
firsttwoinitialcheck
Check1 YoualsoreceivetheKMOand
Inthesamplerisesufficient
AKAisthe
couplerisemore Bartlett'stest 2
than10thevariable
10 11 111
couplerise 114 more than111 Pvalue
sufficient
check3 TheKaiserMeyerIlkintest
Check2 Aretheitemcorrelated Meaner thereis a
if
Howtobeabove
0,3 on check4 Barlett'stest diffusedpaterninite
thismeantherearemany HoMatrix Identity the
matrix correlationbetween
correlation Negativeisalsookay Hy VariablesarecorrelatedVariableor a compact
to
WewanttorejectHo patternwithitarese
whichiswhenPvalue correlation
isbelow0,05 Ifbetweenasand1 PCA