QUESTION 1: Calculation of Closing Inventory
(Weighted Average Method)
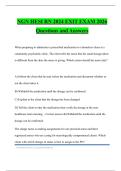
The weighted average cost is recalculated after each purchase. Issues to
production are valued at the current weighted average cost.
Inventory
Date Transaction Units Cost/Unit Total Cost
Balance
Units Cost/Unit Total Cost
1-Dec Opening Inventory 1,000 R 25.00 R 25,000
Issued to
5-Dec -400 R 25.00 (R 10,000) 600 R 25.00 R 15,000
Production
, 10-Dec Purchased 1,080 R 27.00 R 29,160 1,680 R 26.29 R 44,160
*R44,160/1,680
Weighted Avg Cost
*
Issued to
15-Dec -400 R 26.29 (R 10,516) 1,280 R 26.29 R 33,644
Production
Issued to
16-Dec -600 R 26.29 (R 15,774) 680 R 26.29 R 17,870
Production
20-Dec Purchase Return -200 R 27.00 (R 5,400) 480 R 25.98 R 12,470
Weighted Avg
R12,470
Cost
QUESTION 2:
Ratio Analysis
for Mmekwa Ltd
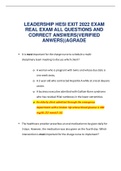
2.1 Current Ratio
The current ratio measures a company's ability to pay its short-term obligations. Mmekwa's ratio is
extremely high (11.1:1 in 2024, up from an already high 15.8:1 in 2023), far exceeding the industry
average of 3:1. This suggests the company is very liquid but may be holding excessive idle cash or
inventory, which is an inefficient use of assets that could be invested for growth.
2.2 Quick Ratio
(Weighted Average Method)
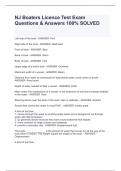
The weighted average cost is recalculated after each purchase. Issues to
production are valued at the current weighted average cost.
Inventory
Date Transaction Units Cost/Unit Total Cost
Balance
Units Cost/Unit Total Cost
1-Dec Opening Inventory 1,000 R 25.00 R 25,000
Issued to
5-Dec -400 R 25.00 (R 10,000) 600 R 25.00 R 15,000
Production
, 10-Dec Purchased 1,080 R 27.00 R 29,160 1,680 R 26.29 R 44,160
*R44,160/1,680
Weighted Avg Cost
*
Issued to
15-Dec -400 R 26.29 (R 10,516) 1,280 R 26.29 R 33,644
Production
Issued to
16-Dec -600 R 26.29 (R 15,774) 680 R 26.29 R 17,870
Production
20-Dec Purchase Return -200 R 27.00 (R 5,400) 480 R 25.98 R 12,470
Weighted Avg
R12,470
Cost
QUESTION 2:
Ratio Analysis
for Mmekwa Ltd
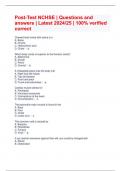
2.1 Current Ratio
The current ratio measures a company's ability to pay its short-term obligations. Mmekwa's ratio is
extremely high (11.1:1 in 2024, up from an already high 15.8:1 in 2023), far exceeding the industry
average of 3:1. This suggests the company is very liquid but may be holding excessive idle cash or
inventory, which is an inefficient use of assets that could be invested for growth.
2.2 Quick Ratio