Contents
Section A: Optimization techniques .............................................................................. 2
Syllabus theme 1: Data Transformations and relationships with economic
applications ..................................................................................................................... 2
1.7. Linear inequalities and systems thereof .............................................................. 2
1.8 Graphical solution ................................................................................................. 6
1.9 Extreme point method ........................................................................................ 10
Syllabus theme 2 ........................................................................................................... 14
2.1 LIMIT OF A FUNCTION .............................................................................................. 14
2.2 Continuity .................................................................................................................... 20
2.3 Rate of change........................................................................................................... 23
2.4 Derivative of a function....................................................................................... 26
2.5 Differentiation rules .............................................................................................. 28
2.6 Higher order derivatives ...................................................................................... 30
2.7 Maxima and minima ........................................................................................... 31
2.8 Area under the curve .......................................................................................... 37
2.9 Application of definite integrals ......................................................................... 45
Section B ........................................................................................................................ 48
Syllabus Theme 1: Probability ....................................................................................... 48
1.2 Discrete Probability distribution........................................................................... 48
1.3 Continuous probability ........................................................................................ 55
Syllabus Theme 2: Statistical Inference ........................................................................ 61
2.1 Sampling and Sampling Distribution .................................................................. 61
2.2 Interval Estimation ................................................................................................ 73
2.3 Hypothesis testing (One sample) ........................................................................ 80
2.4 Hypothesis testing (Two Samples)....................................................................... 93
1
,Section A: Optimization techniques
Syllabus theme 1: Data Transformations and relationships with
economic applications
1.7. LINEAR INEQUALITIES AND SYSTEMS THEREOF
Definitions Linear function y =x (line)
Strict linear inequality y < x (region, dotted line)
Weak linear inequality y ≤ x(region, solid line)
Graphical 1. Plot the line
representation
2. Shade region of feasible solutions:
all coordinates that satisfy the inequality
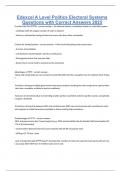
Example 1 2x + 3y 12
weak linear inequality
1. Rewrite as y 4 – 2/3x
2. Plot line
o y = 0:
o 0 = 4 – 2/3x
o x=6
o x = 0:
o y= 4 – 2/3(0)
o y=4
3. Shade region
o if x = 0 then y 4
o if y = 0 then x 6
4. Graph
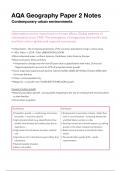
Example 2 x – y > -3
2
, 1. Rewrite as y 4 – 2/3x
2. Plot line
y = 0:
0=x+3
x = -3
x = 0:
y= 0 + 3
y=3
3. Shade region
if x = 0 then y < 4
if y = 0 then x > -3
4. Graph
Straight line is not included
System of Definition:
linear
When more than one linear inequality is represented on the same
inequalities
graph
Region of feasible solutions:
All points whose co-ordinates satisfy all the inequalities
simultaneously, thus the solution area
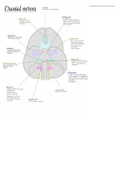
Example
1. 2x + 3y 12:
(0;4)(6;0)
2. x + 2y > 4
(0;2)(4;0)
3
, 3. x – y > -3
(0;3)(-3;0)
Shaded region = region of feasible solutions: consisting of all
points whose co-ordinates satisfy all the inequalities
simultaneously
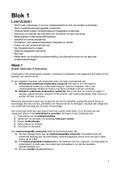
Practical 1. Man’s hours available:
application
24 for moulding / painting
16 for firing process
x coffee sets:
3h for moulding/ painting
2h for firing
y tea sets:
2h for moulding/ painting
1h for firing
2. Conditions:
3x + 2y 24
2x + 1y 16
x≥0
4
Section A: Optimization techniques .............................................................................. 2
Syllabus theme 1: Data Transformations and relationships with economic
applications ..................................................................................................................... 2
1.7. Linear inequalities and systems thereof .............................................................. 2
1.8 Graphical solution ................................................................................................. 6
1.9 Extreme point method ........................................................................................ 10
Syllabus theme 2 ........................................................................................................... 14
2.1 LIMIT OF A FUNCTION .............................................................................................. 14
2.2 Continuity .................................................................................................................... 20
2.3 Rate of change........................................................................................................... 23
2.4 Derivative of a function....................................................................................... 26
2.5 Differentiation rules .............................................................................................. 28
2.6 Higher order derivatives ...................................................................................... 30
2.7 Maxima and minima ........................................................................................... 31
2.8 Area under the curve .......................................................................................... 37
2.9 Application of definite integrals ......................................................................... 45
Section B ........................................................................................................................ 48
Syllabus Theme 1: Probability ....................................................................................... 48
1.2 Discrete Probability distribution........................................................................... 48
1.3 Continuous probability ........................................................................................ 55
Syllabus Theme 2: Statistical Inference ........................................................................ 61
2.1 Sampling and Sampling Distribution .................................................................. 61
2.2 Interval Estimation ................................................................................................ 73
2.3 Hypothesis testing (One sample) ........................................................................ 80
2.4 Hypothesis testing (Two Samples)....................................................................... 93
1
,Section A: Optimization techniques
Syllabus theme 1: Data Transformations and relationships with
economic applications
1.7. LINEAR INEQUALITIES AND SYSTEMS THEREOF
Definitions Linear function y =x (line)
Strict linear inequality y < x (region, dotted line)
Weak linear inequality y ≤ x(region, solid line)
Graphical 1. Plot the line
representation
2. Shade region of feasible solutions:
all coordinates that satisfy the inequality
Example 1 2x + 3y 12
weak linear inequality
1. Rewrite as y 4 – 2/3x
2. Plot line
o y = 0:
o 0 = 4 – 2/3x
o x=6
o x = 0:
o y= 4 – 2/3(0)
o y=4
3. Shade region
o if x = 0 then y 4
o if y = 0 then x 6
4. Graph
Example 2 x – y > -3
2
, 1. Rewrite as y 4 – 2/3x
2. Plot line
y = 0:
0=x+3
x = -3
x = 0:
y= 0 + 3
y=3
3. Shade region
if x = 0 then y < 4
if y = 0 then x > -3
4. Graph
Straight line is not included
System of Definition:
linear
When more than one linear inequality is represented on the same
inequalities
graph
Region of feasible solutions:
All points whose co-ordinates satisfy all the inequalities
simultaneously, thus the solution area
Example
1. 2x + 3y 12:
(0;4)(6;0)
2. x + 2y > 4
(0;2)(4;0)
3
, 3. x – y > -3
(0;3)(-3;0)
Shaded region = region of feasible solutions: consisting of all
points whose co-ordinates satisfy all the inequalities
simultaneously
Practical 1. Man’s hours available:
application
24 for moulding / painting
16 for firing process
x coffee sets:
3h for moulding/ painting
2h for firing
y tea sets:
2h for moulding/ painting
1h for firing
2. Conditions:
3x + 2y 24
2x + 1y 16
x≥0
4