ECS3703
Assignment 2
Semester 2
DUE September 2025
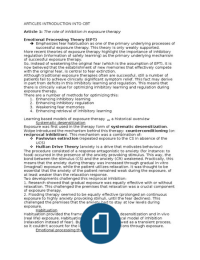
, Question 1 (15)
Diagram (market for ZAR in China)
• Vertical axis: exchange rate in RMB per ZAR (¥/R).
• Horizontal axis: quantity of ZAR traded in China.
• D₀: initial Chinese demand for ZAR (from Chinese importers buying South African
goods).
• S₀: supply of ZAR (from South Africans demanding Chinese goods/assets and
supplying rand in exchange for RMB).
• A tariff increase on South African exports to China reduces Chinese imports from
SA → demand for ZAR falls → D shifts left to D₁.
Assignment 2
Semester 2
DUE September 2025
, Question 1 (15)
Diagram (market for ZAR in China)
• Vertical axis: exchange rate in RMB per ZAR (¥/R).
• Horizontal axis: quantity of ZAR traded in China.
• D₀: initial Chinese demand for ZAR (from Chinese importers buying South African
goods).
• S₀: supply of ZAR (from South Africans demanding Chinese goods/assets and
supplying rand in exchange for RMB).
• A tariff increase on South African exports to China reduces Chinese imports from
SA → demand for ZAR falls → D shifts left to D₁.