, MIP1502 Assignment 4
Semester 2 2025(721016)
DUE 15 August 2025
Use this document as a guide and for references to answer your assignment
Question 1
This question requires you to move beyond simply solving mathematical problems. You will analyse functional
relationships, diagnose a common learner misconception based on the principles in your learning material, and
design a learning activity that aligns with the CAPS curriculum for the Intermediate Phase.
1.1 Consider the two real-world situations below. The first represents a linear function, and the second
represents a non-linear function.
• Situation 1 (Linear): A rental van costs R230 per day plus R4,30 per kilometre driven.
• Situation 2 (Non-linear): The area of a circle depends on the length of its radius.
For each situation, you must:
1.1.1 Identify the independent variable (input) and the dependent variable (output). (2)
Situation 1 (Linear):
Independent variable: Kilometres driven (let's denote it as x)
Dependent variable: Total cost of rental (f(x))
Situation 2 (Non-linear):
Independent variable: Radius of the circle (r)
Dependent variable: Area of the circle (A(r))
1.1.2 Write a function rule using function notation (e.g., 𝑓𝑓(𝑥𝑥)=…). Use the standard
formula for the area of a circle in Situation 2. (2)
Situation 1:
f(x)=230+4.30x
(R230 fixed cost + R4.30 per km)
, Situation 2:
A(r)=πr2
A(r)=πr2
(Area of a circle)
1.1.3 Create a table of values showing at least four different, realistic inputs and their
corresponding outputs. (2)
Situation 1 (Linear):
Kilometres (x) Cost f(x) = 230 + 4.30x
0 R230.00
50 R445.00
100 R660.00
150 R875.00
Situation 2 (Non-linear): (Use π ≈ 3.14)
Radius (r) Area A(r) = πr²
1 3.14
2 12.56
3 28.26
4 50.24
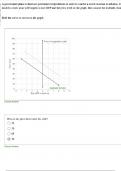
1.1.4 Sketch a graph for each function on a separate set of axes. Label your axes clearly
with the variable names. (2)
(Since sketches can't be drawn directly here, describe how the graphs would look:)
Graph 1 (Linear):
o X-axis: Kilometres
o Y-axis: Total cost (R)
o A straight line starting at (0, 230) and increasing steadily
Graph 2 (Non-linear):
o X-axis: Radius
o Y-axis: Area
o A curve starting near the origin, increasing rapidly (parabolic shape),
showing that small increases in radius lead to larger increases in area
Semester 2 2025(721016)
DUE 15 August 2025
Use this document as a guide and for references to answer your assignment
Question 1
This question requires you to move beyond simply solving mathematical problems. You will analyse functional
relationships, diagnose a common learner misconception based on the principles in your learning material, and
design a learning activity that aligns with the CAPS curriculum for the Intermediate Phase.
1.1 Consider the two real-world situations below. The first represents a linear function, and the second
represents a non-linear function.
• Situation 1 (Linear): A rental van costs R230 per day plus R4,30 per kilometre driven.
• Situation 2 (Non-linear): The area of a circle depends on the length of its radius.
For each situation, you must:
1.1.1 Identify the independent variable (input) and the dependent variable (output). (2)
Situation 1 (Linear):
Independent variable: Kilometres driven (let's denote it as x)
Dependent variable: Total cost of rental (f(x))
Situation 2 (Non-linear):
Independent variable: Radius of the circle (r)
Dependent variable: Area of the circle (A(r))
1.1.2 Write a function rule using function notation (e.g., 𝑓𝑓(𝑥𝑥)=…). Use the standard
formula for the area of a circle in Situation 2. (2)
Situation 1:
f(x)=230+4.30x
(R230 fixed cost + R4.30 per km)
, Situation 2:
A(r)=πr2
A(r)=πr2
(Area of a circle)
1.1.3 Create a table of values showing at least four different, realistic inputs and their
corresponding outputs. (2)
Situation 1 (Linear):
Kilometres (x) Cost f(x) = 230 + 4.30x
0 R230.00
50 R445.00
100 R660.00
150 R875.00
Situation 2 (Non-linear): (Use π ≈ 3.14)
Radius (r) Area A(r) = πr²
1 3.14
2 12.56
3 28.26
4 50.24
1.1.4 Sketch a graph for each function on a separate set of axes. Label your axes clearly
with the variable names. (2)
(Since sketches can't be drawn directly here, describe how the graphs would look:)
Graph 1 (Linear):
o X-axis: Kilometres
o Y-axis: Total cost (R)
o A straight line starting at (0, 230) and increasing steadily
Graph 2 (Non-linear):
o X-axis: Radius
o Y-axis: Area
o A curve starting near the origin, increasing rapidly (parabolic shape),
showing that small increases in radius lead to larger increases in area