Vrije Universiteit Brussel
Statistiek I: RStudio inputs
Tekstbestand met gegevens openen in RStudio
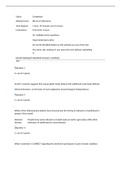
• Kies File > Import Dataset > From Text (base)
• Blader om het bestand te vinden dat je wil importeren.
o Separatie via een tab = tab-delimited text file extensie: .txt
o Separatie via komma = comma-separated values text file extensie: .cvs
o Separatie via teken = character-separated values text file extensie: .cvs
• Klik op import. In het paneel linksboven verschijnt de gegevenstabel.
We gaan nu de naam van de gegevensverzameling vasthangen aan het zoekpad. Geef in de
console:
attach(my.data)
Gebruik de naam van de gegevensverzameling die in het tabblad linksbovenaan staat
Frequentietabel
table(my.data)
Marginale sommen
marginSums(table(my.data), margin = NULL)
NULL = het totaal
1 = kolomtotalen
2 = rijtotalen
Staafdiagrammen
Absolute frequentie
a) De gegevens komen uit een dataset
barplot(table(my.data), las=1)
barplot(sort(table(my.data)), las=1) → gesorteerd
b) De gegevens komen niet uit een dataset
Source ← c(“Google”, “TikTok”, “Facebook”, “Mobile”, “Other”)
Visits ← c(34324, 43324, 45321, 56231, 13525)
barplot(Visits, names.arg = Source, las=1)
Relatieve frequentie
a) De gegevens komen uit een dataset
my.data.as.percentages ← table(my.data)/sum(table(my.data))*100
barplot(table(my.data.as.percentages), las=1)
Academiejaar 2024-2025 1
Statistiek I: RStudio inputs
Tekstbestand met gegevens openen in RStudio
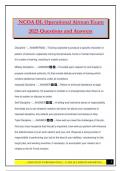
• Kies File > Import Dataset > From Text (base)
• Blader om het bestand te vinden dat je wil importeren.
o Separatie via een tab = tab-delimited text file extensie: .txt
o Separatie via komma = comma-separated values text file extensie: .cvs
o Separatie via teken = character-separated values text file extensie: .cvs
• Klik op import. In het paneel linksboven verschijnt de gegevenstabel.
We gaan nu de naam van de gegevensverzameling vasthangen aan het zoekpad. Geef in de
console:
attach(my.data)
Gebruik de naam van de gegevensverzameling die in het tabblad linksbovenaan staat
Frequentietabel
table(my.data)
Marginale sommen
marginSums(table(my.data), margin = NULL)
NULL = het totaal
1 = kolomtotalen
2 = rijtotalen
Staafdiagrammen
Absolute frequentie
a) De gegevens komen uit een dataset
barplot(table(my.data), las=1)
barplot(sort(table(my.data)), las=1) → gesorteerd
b) De gegevens komen niet uit een dataset
Source ← c(“Google”, “TikTok”, “Facebook”, “Mobile”, “Other”)
Visits ← c(34324, 43324, 45321, 56231, 13525)
barplot(Visits, names.arg = Source, las=1)
Relatieve frequentie
a) De gegevens komen uit een dataset
my.data.as.percentages ← table(my.data)/sum(table(my.data))*100
barplot(table(my.data.as.percentages), las=1)
Academiejaar 2024-2025 1