OSCAR THE TUTOR
+27737560989
Ques on 1 for FAC MAC ECS DSC TAX QMI FIN INV BNU STA tutorials
2
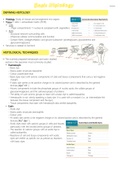
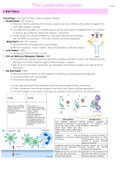
TRADE % OF GDP FOR THE YEARS 2004-2023
Botswana Luxembourg Hong Kong SAR, China South Africa Singapore Ghana
500
450
400
350
TRADE % OF GDP
300
250
200
150
100
50
0
2 0 0 42 0 0 52 0 0 62 0 0 72 0 0 82 0 0 92 0 1 02 0 1 12 0 1 22 0 1 32 0 1 42 0 1 52 0 1 62 0 1 72 0 1 82 0 1 92 0 2 02 0 2 12 0 2 22 0 2 3
YEARS
Data from database: World Development Indicators
Last Updated: 03/24/2025
QUESTION 3: Trends in Trade Openness (Expanded with South African Context)
The dataset illustrates stark contrasts in trade openness (% of GDP) among Botswana,
Luxembourg, Hong Kong SAR, South Africa, Singapore, and Ghana from 2004–2023. These
trends reflect structural dispari es and external vulnerabili es, offering lessons for South
Africa’s trade policy landscape.
1. High-Openness Economies (250%+ Trade-to-GDP)
Luxembourg (265% in 2004 to 394% in 2023): As a financial hub, Luxembourg’s growth
mirrors global capital flows and EU integra on. Its minor dips during crises (e.g., 263% in
2009) contrast with South Africa’s slower recovery post-2008, underscoring the benefits
of regional trade blocs like the EU versus Africa’s fragmented markets (Edwards &
Lawrence, 2008).
, Hong Kong SAR: Peaked at 443% (2013) but declined to 353% (2023) due to U.S.-China
trade tensions. South Africa, similarly, faces export risks from geopoli cal shi s, such as
reliance on China for mineral exports (Hausmann, 2016).
Singapore (401% in 2004 to 311% in 2023): Vola lity reflects its role as a global
transshipment hub. South Africa’s ports (e.g., Durban) lag due to inefficiencies, limi ng
similar growth (Viviers & Steenkamp, 2019).
2. Moderate-Openness Economies (60–126%)
Botswana: Peaked at 126% (2013) but fell to 69% (2023) due to diamond price vola lity.
Like Botswana, South Africa’s pla num sector suffers from commodity dependence, but
greater industrial diversifica on buffers shocks (SARB, 2022).
Ghana: Oscillated between 60% and 93%, reflec ng cocoa/oil reliance. South Africa’s
agricultural exports (e.g., citrus) face similar vola lity but benefit from diversified
markets (DAFF, 2021).
3. Lower-Openness Economy: South Africa (45–66%)
South Africa’s trade ra os (peaking at 66% in 2008) are the lowest among peers, reflec ng a
domes cally oriented economy. Unlike Singapore, South Africa’s manufacturing sector (12% of
GDP) struggles with energy shortages and labor strikes, reducing export compe veness
(Nedbank, 2023). The COVID-19 rebound to 65% (2023) mirrors par al recovery in mining
exports but highlights structural constraints, akin to Ghana’s port inefficiencies.
Key Peaks and Troughs:
2008–2009 Crisis: South Africa’s drop to 50% (2009) parallels Singapore’s decline but
was exacerbated by domes c energy crises.
Post-2010 Recovery: Botswana’s 2013 peak (126%) contrasts with South Africa’s
stagna on, emphasizing the risks of over-reliance on minerals versus diversified exports.
COVID-19: South Africa’s imports fell faster than exports, unlike Luxembourg’s service-
driven resilience, reflec ng systemic rigidi es.
QUESTION 4: Reasons for Differences in Trade Openness (South African Lens)
1. Structural and Historical Factors
Commodity Dependence: Botswana (diamonds) and Ghana (cocoa) resemble South
Africa’s pla num and coal sectors. However, South Africa’s Industrial Policy Ac on Plan
OSCAR THE TUTOR
+27737560989
for FAC MAC ECS DSC TAX QMI FIN
INV BNU STA tutorials
+27737560989
Ques on 1 for FAC MAC ECS DSC TAX QMI FIN INV BNU STA tutorials
2
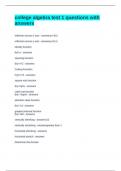
TRADE % OF GDP FOR THE YEARS 2004-2023
Botswana Luxembourg Hong Kong SAR, China South Africa Singapore Ghana
500
450
400
350
TRADE % OF GDP
300
250
200
150
100
50
0
2 0 0 42 0 0 52 0 0 62 0 0 72 0 0 82 0 0 92 0 1 02 0 1 12 0 1 22 0 1 32 0 1 42 0 1 52 0 1 62 0 1 72 0 1 82 0 1 92 0 2 02 0 2 12 0 2 22 0 2 3
YEARS
Data from database: World Development Indicators
Last Updated: 03/24/2025
QUESTION 3: Trends in Trade Openness (Expanded with South African Context)
The dataset illustrates stark contrasts in trade openness (% of GDP) among Botswana,
Luxembourg, Hong Kong SAR, South Africa, Singapore, and Ghana from 2004–2023. These
trends reflect structural dispari es and external vulnerabili es, offering lessons for South
Africa’s trade policy landscape.
1. High-Openness Economies (250%+ Trade-to-GDP)
Luxembourg (265% in 2004 to 394% in 2023): As a financial hub, Luxembourg’s growth
mirrors global capital flows and EU integra on. Its minor dips during crises (e.g., 263% in
2009) contrast with South Africa’s slower recovery post-2008, underscoring the benefits
of regional trade blocs like the EU versus Africa’s fragmented markets (Edwards &
Lawrence, 2008).
, Hong Kong SAR: Peaked at 443% (2013) but declined to 353% (2023) due to U.S.-China
trade tensions. South Africa, similarly, faces export risks from geopoli cal shi s, such as
reliance on China for mineral exports (Hausmann, 2016).
Singapore (401% in 2004 to 311% in 2023): Vola lity reflects its role as a global
transshipment hub. South Africa’s ports (e.g., Durban) lag due to inefficiencies, limi ng
similar growth (Viviers & Steenkamp, 2019).
2. Moderate-Openness Economies (60–126%)
Botswana: Peaked at 126% (2013) but fell to 69% (2023) due to diamond price vola lity.
Like Botswana, South Africa’s pla num sector suffers from commodity dependence, but
greater industrial diversifica on buffers shocks (SARB, 2022).
Ghana: Oscillated between 60% and 93%, reflec ng cocoa/oil reliance. South Africa’s
agricultural exports (e.g., citrus) face similar vola lity but benefit from diversified
markets (DAFF, 2021).
3. Lower-Openness Economy: South Africa (45–66%)
South Africa’s trade ra os (peaking at 66% in 2008) are the lowest among peers, reflec ng a
domes cally oriented economy. Unlike Singapore, South Africa’s manufacturing sector (12% of
GDP) struggles with energy shortages and labor strikes, reducing export compe veness
(Nedbank, 2023). The COVID-19 rebound to 65% (2023) mirrors par al recovery in mining
exports but highlights structural constraints, akin to Ghana’s port inefficiencies.
Key Peaks and Troughs:
2008–2009 Crisis: South Africa’s drop to 50% (2009) parallels Singapore’s decline but
was exacerbated by domes c energy crises.
Post-2010 Recovery: Botswana’s 2013 peak (126%) contrasts with South Africa’s
stagna on, emphasizing the risks of over-reliance on minerals versus diversified exports.
COVID-19: South Africa’s imports fell faster than exports, unlike Luxembourg’s service-
driven resilience, reflec ng systemic rigidi es.
QUESTION 4: Reasons for Differences in Trade Openness (South African Lens)
1. Structural and Historical Factors
Commodity Dependence: Botswana (diamonds) and Ghana (cocoa) resemble South
Africa’s pla num and coal sectors. However, South Africa’s Industrial Policy Ac on Plan
OSCAR THE TUTOR
+27737560989
for FAC MAC ECS DSC TAX QMI FIN
INV BNU STA tutorials