Statistics. A tool for Social Research. Healey J.F.
2. Basic Descriptive Statistics: Tables, Percentages, Ratios and Rates, and
Graphs
Researchers use statistics to organize and manipulate data so that their meaning can
be understood by their readers. The purpose of descriptive statistics is to clarify and
express research findings effectively. Often, the first step in a quantitative research
project is to examine the variables and see how scores are distributed. One of the
most useful ways to do this is to construct tables, or frequency distributions, that
report the number of cases in each category for all variables.
Frequency distribution for nominal-level variables
- Count the number of times each category or score of the variable occurs and
display the frequency in table format.
-
Enhancing clarity: percentages and proportions
- Percentages are easier to read and comprehend than raw frequencies, and a
column for percentages is commonly added to frequency distributions for
variables at all levels of measurement.
- Percentages are extremely useful for statistics because they supply a frame of
reference by standardizing the raw frequencies to the base 100.
-
- The advantage of using percentages is particularly obvious when we want to
compare groups of different sizes.
- Social scientists use proportions as well as percentages. Proportions vary
from 0.00 to 1.00: they standardize results to a base of 1.00 instead of to the
base of 100 used for percentages.
- Percentages can be converted to proportions by dividing by 100, and
conversely, proportions can be converted to percentages by multiplying by
100. The two statistics are equivalent expressions of the same message and
are interchangeable.
, -
- Guidelines to make sure you are upfront about your data:
1. When the number of cases (N) is small (fewer than 20), it is preferable to
report the actual frequencies rather than percentages or proportions.
2. Always report the number of observations along with proportions and
percentages.
3. Percentages and proportions can be calculated for variables at the ordinal
and nominal levels of measurement, in spite of the fact that they require
division.
Frequency distributions for ordinal-level variables
- Frequency distributions for ordinal-level variables are constructed in the same
way as for nominal-level variables.
-
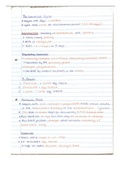
Frequency distributions for interval-ratio-level variables
- Interval-ratio variables usually have a wide range of scores, and this means
that the researcher must collapse or group categories to produce reasonably
compact tables.
- The categories are often called class intervals when working with interval-
ratio data.
- To avoid the choice of where to put a data, we always state the class limits at
the same level of precision as the data. This is called the stated class limits.
- If you state the limits of the class intervals at the same level of precision as the
data and maintain a gap between intervals, you will always produce a
frequency distribution where each case can be assigned to one and only one
category.
- Midpoints are exactly halfway between the upper and lower limits of a class
interval and can be found by dividing the sum of the upper and lower limits by
2
, -
-
- To construct certain graphs, we must eliminate the gap between class intervals
and treat a distribution as a continuous series of categories that border each
other. These would be the real class limits.
-
- Two commonly used adjuncts to the basic frequency distributions for interval-
ratio data are the cumulative frequency and cumulative percentage
columns. These columns allow us to tell at a glance how many cases fall
below or above a given score or class interval in the distribution.
2. Basic Descriptive Statistics: Tables, Percentages, Ratios and Rates, and
Graphs
Researchers use statistics to organize and manipulate data so that their meaning can
be understood by their readers. The purpose of descriptive statistics is to clarify and
express research findings effectively. Often, the first step in a quantitative research
project is to examine the variables and see how scores are distributed. One of the
most useful ways to do this is to construct tables, or frequency distributions, that
report the number of cases in each category for all variables.
Frequency distribution for nominal-level variables
- Count the number of times each category or score of the variable occurs and
display the frequency in table format.
-
Enhancing clarity: percentages and proportions
- Percentages are easier to read and comprehend than raw frequencies, and a
column for percentages is commonly added to frequency distributions for
variables at all levels of measurement.
- Percentages are extremely useful for statistics because they supply a frame of
reference by standardizing the raw frequencies to the base 100.
-
- The advantage of using percentages is particularly obvious when we want to
compare groups of different sizes.
- Social scientists use proportions as well as percentages. Proportions vary
from 0.00 to 1.00: they standardize results to a base of 1.00 instead of to the
base of 100 used for percentages.
- Percentages can be converted to proportions by dividing by 100, and
conversely, proportions can be converted to percentages by multiplying by
100. The two statistics are equivalent expressions of the same message and
are interchangeable.
, -
- Guidelines to make sure you are upfront about your data:
1. When the number of cases (N) is small (fewer than 20), it is preferable to
report the actual frequencies rather than percentages or proportions.
2. Always report the number of observations along with proportions and
percentages.
3. Percentages and proportions can be calculated for variables at the ordinal
and nominal levels of measurement, in spite of the fact that they require
division.
Frequency distributions for ordinal-level variables
- Frequency distributions for ordinal-level variables are constructed in the same
way as for nominal-level variables.
-
Frequency distributions for interval-ratio-level variables
- Interval-ratio variables usually have a wide range of scores, and this means
that the researcher must collapse or group categories to produce reasonably
compact tables.
- The categories are often called class intervals when working with interval-
ratio data.
- To avoid the choice of where to put a data, we always state the class limits at
the same level of precision as the data. This is called the stated class limits.
- If you state the limits of the class intervals at the same level of precision as the
data and maintain a gap between intervals, you will always produce a
frequency distribution where each case can be assigned to one and only one
category.
- Midpoints are exactly halfway between the upper and lower limits of a class
interval and can be found by dividing the sum of the upper and lower limits by
2
, -
-
- To construct certain graphs, we must eliminate the gap between class intervals
and treat a distribution as a continuous series of categories that border each
other. These would be the real class limits.
-
- Two commonly used adjuncts to the basic frequency distributions for interval-
ratio data are the cumulative frequency and cumulative percentage
columns. These columns allow us to tell at a glance how many cases fall
below or above a given score or class interval in the distribution.