HOMEWORK SEMINARS
Block GZW3024, Linear Regression, seminar 2, Homework assignment
Below you find the results of a statistical analysis on data obtained for a cohort of health sciences
students at Maastricht University (N = 213). Registered were the students’ age, gender, whether
they smoked or not, but also their body length (in meters) and percentage of body fat. Body
length is denoted in the analysis as “length” and percentage of body fat as “percfat”. Whenever
required, use a significance level of 5%. The following results were obtained in SPSS:
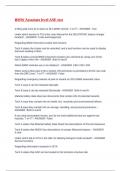
Variables Entered/Removeda
Model Variables Entered Variables Removed Method
1 lengthb . Enter
a. Dependent Variable: percfat
b. All requested variables entered.
Model Summary
Model R R Square Adjusted R Square Std. Error of the Estimate
1 .482a .232 .229 6.12109
a. Predictors: (Constant), length
ANOVAa
Model Sum of Squares df Mean Square F Sig.
1 Regression 2548.245 1 2548.245 68.012 .000b
Residual 8430.248 225 37.468
Total 10978.494 226
a. Dependent Variable: percfat
b. Predictors: (Constant), length
Coefficientsa
Unstandardized Coefficients Standardized Coefficients
Model B Std. Error Beta t Sig.
1 (Constant) 93.875 8.530 11.005 .000
length -40.578 4.920 -.482 -8.247 .000
a. Dependent Variable: percfat
, 1. Write down the regression equation as estimated for the student sample:
Y = b0 + b1*x + e = 93.875 – 40.578*x + 6.12109
Y = b0 + b1*x + e = 93.875 – 40.578*x (length) + ei → specifieke steekproef
2. Explain whether there is a positive or negative relation between body length and
percfat in the sample of students
There is a negative relation between body length and percentage of body fat. B1
(regression coefficient) (slope) is a negative number.
What is the correlation between body length and percfat in the sample?
A negative correlation, the longer you are, the smaller the fat percentage. Correlation is
-0.482 (staat bij R), - omdat de relatie ook negatief is.
3. Write down the prediction equation:
Y = 93.875 – 40.578*x
4. If the body length increases with 0.1 m, how much does the predicted value for
percfat change ? Explain your answer.
Y = 93.875 – 40.578*x + 6.12109 = 99.9959
Y = 93.875 – 40.578*0.1 + 6.12109 = 95.93829
99.9959 - 95.93829 = 4,1 % less fat when 0.1 length increases with 0.1 m.
Easier: 0.1 * 40.578 = 4.1% increase in fat when becoming 0.1 m longer.
,5. What is your evaluation of the quality of the regression line. Explain your answer
R-square is 0.232, this is not very close to 1 (which means perfect estimation). Therefore,
the quality of the regression line is not very high. Betekent dat 23.2% van de variatie in de
outcome variabele (percfat) kan worden verklaart met de predictor variabele. In dit geval
is de puntenwolk wijd verspreid.
Residual sum squares = niet verklaarbare variatie
Regression sum squares= verklaarbaar met variatie in predictor variabele
6. For the analysis given above, write down the regression model for the population.
Perfcat = B0 + B1 length + Ɛi
7. You would like to know whether there is a relation between body length and percfat
in the population of students. Formulate the null and the alternative hypothesis in
terms of the parameters of the population regression model.
H0: B1 = 0
H1: B1 ≠ 0
8. Report a statistical test statistic for these hypotheses. What value does it have, and
what is the corresponding p-value ?
This is two-sides testing with 𝛼 = 0.05, this means the p-value has to be lower than 0.05 to
be significant. In the SPSS data you can see a p-value of 0.00.
T statistic = -8.247; p value < 0.001
9. Explain whether we should accept or reject the null hypothesis. Conclude whether
there is or there is no relation between body length and percfat in the population.
The p-value is lower than 0.05, therefore the null hypothesis should be rejected. There is a
significant relation between body length and percentage of fat in the population.
, Block GZW3024, Linear Regression, seminar 3, Homework assignment
Thirty-five persons participated in a study, in which their pulse rate (beats per minute) was
measured before and after physical exercise. Of interest was the change in pulse rate, denoted in
the analysis as changepulse = pulse rate after – pulse rate before. The research question is
whether there are differences between males and females in the change of pulse rate due to
exercise. Smoking behavior and body weight are considered as possible effect modifiers. Gender
(0= female, 1 = male), smoke (0= non-smoker, 1= smoker) and weight (in pounds) are the
variables as used in the SPSS analysis. The interactions of smoke and weight with gender are
denoted by gender_smoke and gender_weight respectively. A top-down procedure is followed.
Use a significance level of 5%. Relevant SPSS output is given below:
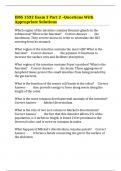
Model Summary
Adjusted R Std. Error of
Model R R Square Square the Estimate
1 .656a .431 .333 12.29554
a. Predictors: (Constant), gender_smoke, gender, weight in
pounds, smoke, gender_weight
Coefficientsa
Standardized
Unstandardized Coefficients Coefficients
Model B Std. Error Beta t Sig.
1 (Constant) 41.929 41.115 1.020 .316
smoke -11.323 7.723 -.362 -1.466 .153
gender -8.325 47.526 -.261 -.175 .862
weight in pounds -.046 .315 -.069 -.145 .886
gender_weight -.073 .349 -.378 -.210 .835
gender_smoke 7.100 9.629 .201 .737 .467
a. Dependent Variable: changepulse
2. When following a top-down procedure which variable should be removed first ?
Gender_weight should be removed first, it is the interaction term which is the least
significant.
Why should weight not be removed ?
Weight is not an interaction term, it is a main effect/variable. You can only look at the
main effects after removing the interaction terms which are not significant. First, look
only at the interaction terms.
Block GZW3024, Linear Regression, seminar 2, Homework assignment
Below you find the results of a statistical analysis on data obtained for a cohort of health sciences
students at Maastricht University (N = 213). Registered were the students’ age, gender, whether
they smoked or not, but also their body length (in meters) and percentage of body fat. Body
length is denoted in the analysis as “length” and percentage of body fat as “percfat”. Whenever
required, use a significance level of 5%. The following results were obtained in SPSS:
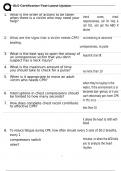
Variables Entered/Removeda
Model Variables Entered Variables Removed Method
1 lengthb . Enter
a. Dependent Variable: percfat
b. All requested variables entered.
Model Summary
Model R R Square Adjusted R Square Std. Error of the Estimate
1 .482a .232 .229 6.12109
a. Predictors: (Constant), length
ANOVAa
Model Sum of Squares df Mean Square F Sig.
1 Regression 2548.245 1 2548.245 68.012 .000b
Residual 8430.248 225 37.468
Total 10978.494 226
a. Dependent Variable: percfat
b. Predictors: (Constant), length
Coefficientsa
Unstandardized Coefficients Standardized Coefficients
Model B Std. Error Beta t Sig.
1 (Constant) 93.875 8.530 11.005 .000
length -40.578 4.920 -.482 -8.247 .000
a. Dependent Variable: percfat
, 1. Write down the regression equation as estimated for the student sample:
Y = b0 + b1*x + e = 93.875 – 40.578*x + 6.12109
Y = b0 + b1*x + e = 93.875 – 40.578*x (length) + ei → specifieke steekproef
2. Explain whether there is a positive or negative relation between body length and
percfat in the sample of students
There is a negative relation between body length and percentage of body fat. B1
(regression coefficient) (slope) is a negative number.
What is the correlation between body length and percfat in the sample?
A negative correlation, the longer you are, the smaller the fat percentage. Correlation is
-0.482 (staat bij R), - omdat de relatie ook negatief is.
3. Write down the prediction equation:
Y = 93.875 – 40.578*x
4. If the body length increases with 0.1 m, how much does the predicted value for
percfat change ? Explain your answer.
Y = 93.875 – 40.578*x + 6.12109 = 99.9959
Y = 93.875 – 40.578*0.1 + 6.12109 = 95.93829
99.9959 - 95.93829 = 4,1 % less fat when 0.1 length increases with 0.1 m.
Easier: 0.1 * 40.578 = 4.1% increase in fat when becoming 0.1 m longer.
,5. What is your evaluation of the quality of the regression line. Explain your answer
R-square is 0.232, this is not very close to 1 (which means perfect estimation). Therefore,
the quality of the regression line is not very high. Betekent dat 23.2% van de variatie in de
outcome variabele (percfat) kan worden verklaart met de predictor variabele. In dit geval
is de puntenwolk wijd verspreid.
Residual sum squares = niet verklaarbare variatie
Regression sum squares= verklaarbaar met variatie in predictor variabele
6. For the analysis given above, write down the regression model for the population.
Perfcat = B0 + B1 length + Ɛi
7. You would like to know whether there is a relation between body length and percfat
in the population of students. Formulate the null and the alternative hypothesis in
terms of the parameters of the population regression model.
H0: B1 = 0
H1: B1 ≠ 0
8. Report a statistical test statistic for these hypotheses. What value does it have, and
what is the corresponding p-value ?
This is two-sides testing with 𝛼 = 0.05, this means the p-value has to be lower than 0.05 to
be significant. In the SPSS data you can see a p-value of 0.00.
T statistic = -8.247; p value < 0.001
9. Explain whether we should accept or reject the null hypothesis. Conclude whether
there is or there is no relation between body length and percfat in the population.
The p-value is lower than 0.05, therefore the null hypothesis should be rejected. There is a
significant relation between body length and percentage of fat in the population.
, Block GZW3024, Linear Regression, seminar 3, Homework assignment
Thirty-five persons participated in a study, in which their pulse rate (beats per minute) was
measured before and after physical exercise. Of interest was the change in pulse rate, denoted in
the analysis as changepulse = pulse rate after – pulse rate before. The research question is
whether there are differences between males and females in the change of pulse rate due to
exercise. Smoking behavior and body weight are considered as possible effect modifiers. Gender
(0= female, 1 = male), smoke (0= non-smoker, 1= smoker) and weight (in pounds) are the
variables as used in the SPSS analysis. The interactions of smoke and weight with gender are
denoted by gender_smoke and gender_weight respectively. A top-down procedure is followed.
Use a significance level of 5%. Relevant SPSS output is given below:
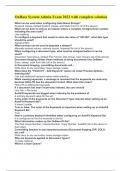
Model Summary
Adjusted R Std. Error of
Model R R Square Square the Estimate
1 .656a .431 .333 12.29554
a. Predictors: (Constant), gender_smoke, gender, weight in
pounds, smoke, gender_weight
Coefficientsa
Standardized
Unstandardized Coefficients Coefficients
Model B Std. Error Beta t Sig.
1 (Constant) 41.929 41.115 1.020 .316
smoke -11.323 7.723 -.362 -1.466 .153
gender -8.325 47.526 -.261 -.175 .862
weight in pounds -.046 .315 -.069 -.145 .886
gender_weight -.073 .349 -.378 -.210 .835
gender_smoke 7.100 9.629 .201 .737 .467
a. Dependent Variable: changepulse
2. When following a top-down procedure which variable should be removed first ?
Gender_weight should be removed first, it is the interaction term which is the least
significant.
Why should weight not be removed ?
Weight is not an interaction term, it is a main effect/variable. You can only look at the
main effects after removing the interaction terms which are not significant. First, look
only at the interaction terms.