GEOGRAPHY FORM THREE WORK.
TOPIC ONE: STATISTICAL MEHODS
By Prof. Ogoti Robert Maxwell
- Methods of presenting statistical data that we learn in form three are:
Compound/ cumulative bar graphs.
Proportional circles
Pie charts
Proportional divided circles.
1. Compound/ Cumulative Bar Graphs.
- Comprise of one or more bars drawn vertically or horizontally with each bar
subdivided so that each portion represents a component of the data that makes the
whole.
- Where two or more bars are drawn, each bar is separated with an equal space between
them.
- Suitable for presenting data depicting the total value of several items.
Example.
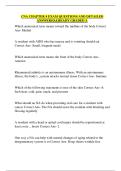
Kcse 2017: The table below shows the number of visitors in ‘000’ to selected national parks
in Kenya for the years 2006 to 2008.
PARK/ YEAR 2006 2007 2008
NAIROBI 102 93 92
AMBOSELI 153 156 82
TSAVO 354 372 182
LAKE NAKURU 327 347 138
TOTAL 946 968 497
Draw a compound bar graph to represent the number of visitors to selected national parks in
Kenya. Use the scale of 1cm to represent 100,000 visitors.
1|P age
, Interpretation of Compound bar Graphs.
- Observe the trend of the bars. Look for the total of the variables of each bar in the
period given.
- Compute the trend of an individual variable against the successive totals of each bar.
- Comment on the trend of each variable.
- From the interpretation, suggest possible reasons to explain the trend of the variables
obtained.
NOTE: The following interpretation can be deduce from the drawn compound bar
graph;
Kenya received more tourists in the year 2007.
Kenya received few tourists in the year 2008.
Tsavo national parks received highest number of tourists for the years 2006 to
2008.
Lake Nakuru is the second national park visited by many tourists.
Tsavo national park received highest number of tourists in 2007.
Nairobi national park received lowest total number of tourists.
Number of tourists who visited Nairobi National park reduced from 2006 to
2008.
2|P age
,Advantages of using compound bar graphs to represent statistical data –kcse 2017
i. They give clear visual impression.
ii. They allow easy comparison.
iii. They are easy to interpret.
iv. They can be used to represent a wide range of data.
Disadvantages of using compound bar graphs.
i.) It consumes a lot of time when drawing.
ii.) It fails to show trend/ change of quantities/ values.
iii.) It is difficult to interpret when many bars are drawn.
iv.) It is difficult to read exact values at a glance.
v.) Represents a few variables/ items.
Assignment.
The table below shows contribution of various energy sources in Kenya in thousand dollars.
Type of power 2018 2019 2020 2021
Hydropower 130 100 100 110
Geothermal 120 140 160 170
Thermal 30 50 40 30
Total 280 290 300 310
a) Using a scale of 1cm represent 50,000 dollars, draw a compound/ cumulative bar
graphs.
b) Give analysis and interpretation of the drawn graph.
2. PROPORTIONAL CIRCLES.
- This method employs the use of circles of various sizes to represent different sets of
data.
- Each circle is drawn to a size proportional to the total value of data it represents. For
example, the smallest value is represented by the smallest circle while the largest
value is represented by the largest circle.
a) Use of circles with diameters proportional to the total values.
i. Round off the totals to the nearest thousands to obtain round figures for ease of working.
ii. Select a suitable scale for the diameter which will in turn be proportional to the total
values.
iii. Use the radii figures to draw the different circles.
Example.
Kcse 2018: The table below shows value of export earnings of selected crops from Kenya
(Ksh. Millions).
CROP 2012 2013 2014
TEA 101441 104648 93996
COFFEE 22271 16328 19913
SISAL 1184 1020 1325
TOTAL 124896 121996 115234
3|P age
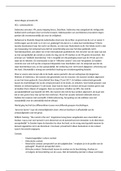
, Draw proportional circles to represent the total export earnings during the period of 2012 to
2014. Use diameter method.
Solution.
Round off the totals.
YEAR TOTALS ROUND OFF
2012 124,896 125,000
2013 121,996 122,000
2014 115234 115,000
Analysis and interpretation of proportional circles –kcse 2018
i.) The total export values for the selected crops was highest in 2012.
ii.) The total export value had a decline for the consecutive years.
iii.) 2014 registered the lowest export value.
iv.) Total exports value for the three years has very little significant difference.
4|P age
TOPIC ONE: STATISTICAL MEHODS
By Prof. Ogoti Robert Maxwell
- Methods of presenting statistical data that we learn in form three are:
Compound/ cumulative bar graphs.
Proportional circles
Pie charts
Proportional divided circles.
1. Compound/ Cumulative Bar Graphs.
- Comprise of one or more bars drawn vertically or horizontally with each bar
subdivided so that each portion represents a component of the data that makes the
whole.
- Where two or more bars are drawn, each bar is separated with an equal space between
them.
- Suitable for presenting data depicting the total value of several items.
Example.
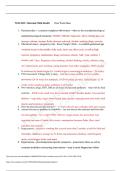
Kcse 2017: The table below shows the number of visitors in ‘000’ to selected national parks
in Kenya for the years 2006 to 2008.
PARK/ YEAR 2006 2007 2008
NAIROBI 102 93 92
AMBOSELI 153 156 82
TSAVO 354 372 182
LAKE NAKURU 327 347 138
TOTAL 946 968 497
Draw a compound bar graph to represent the number of visitors to selected national parks in
Kenya. Use the scale of 1cm to represent 100,000 visitors.
1|P age
, Interpretation of Compound bar Graphs.
- Observe the trend of the bars. Look for the total of the variables of each bar in the
period given.
- Compute the trend of an individual variable against the successive totals of each bar.
- Comment on the trend of each variable.
- From the interpretation, suggest possible reasons to explain the trend of the variables
obtained.
NOTE: The following interpretation can be deduce from the drawn compound bar
graph;
Kenya received more tourists in the year 2007.
Kenya received few tourists in the year 2008.
Tsavo national parks received highest number of tourists for the years 2006 to
2008.
Lake Nakuru is the second national park visited by many tourists.
Tsavo national park received highest number of tourists in 2007.
Nairobi national park received lowest total number of tourists.
Number of tourists who visited Nairobi National park reduced from 2006 to
2008.
2|P age
,Advantages of using compound bar graphs to represent statistical data –kcse 2017
i. They give clear visual impression.
ii. They allow easy comparison.
iii. They are easy to interpret.
iv. They can be used to represent a wide range of data.
Disadvantages of using compound bar graphs.
i.) It consumes a lot of time when drawing.
ii.) It fails to show trend/ change of quantities/ values.
iii.) It is difficult to interpret when many bars are drawn.
iv.) It is difficult to read exact values at a glance.
v.) Represents a few variables/ items.
Assignment.
The table below shows contribution of various energy sources in Kenya in thousand dollars.
Type of power 2018 2019 2020 2021
Hydropower 130 100 100 110
Geothermal 120 140 160 170
Thermal 30 50 40 30
Total 280 290 300 310
a) Using a scale of 1cm represent 50,000 dollars, draw a compound/ cumulative bar
graphs.
b) Give analysis and interpretation of the drawn graph.
2. PROPORTIONAL CIRCLES.
- This method employs the use of circles of various sizes to represent different sets of
data.
- Each circle is drawn to a size proportional to the total value of data it represents. For
example, the smallest value is represented by the smallest circle while the largest
value is represented by the largest circle.
a) Use of circles with diameters proportional to the total values.
i. Round off the totals to the nearest thousands to obtain round figures for ease of working.
ii. Select a suitable scale for the diameter which will in turn be proportional to the total
values.
iii. Use the radii figures to draw the different circles.
Example.
Kcse 2018: The table below shows value of export earnings of selected crops from Kenya
(Ksh. Millions).
CROP 2012 2013 2014
TEA 101441 104648 93996
COFFEE 22271 16328 19913
SISAL 1184 1020 1325
TOTAL 124896 121996 115234
3|P age
, Draw proportional circles to represent the total export earnings during the period of 2012 to
2014. Use diameter method.
Solution.
Round off the totals.
YEAR TOTALS ROUND OFF
2012 124,896 125,000
2013 121,996 122,000
2014 115234 115,000
Analysis and interpretation of proportional circles –kcse 2018
i.) The total export values for the selected crops was highest in 2012.
ii.) The total export value had a decline for the consecutive years.
iii.) 2014 registered the lowest export value.
iv.) Total exports value for the three years has very little significant difference.
4|P age