Analysis of Variance (ANOVA)
Learning Objectives:
● Explain when you would use analysis of variance (ANOVA)
● Interpret the sums of squares in an ANOVA
● Tests hypotheses about the association between a quantitative outcome and one categorical
predictor
● Test the differences between > 2 group means while controlling the Type-1 error rate
● Explain how significance tests and post-hoc comparisons for ANOVA function
Eg Do assignments grades differ across students who work with SPSS, JASP or R?
Descriptive Statistics: comparing >2 means
(1) Analysis of Variance (ANOVA): comparing >2 means
F-test to compare group means
H 0 :μ 1=μ2=μ3
HA : μI ≠ μJ
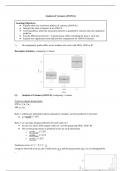
Rule 1: without any information about explanatory variables, our best prediction is the mean
● y=grade=7.475
Rule 2: we can make unique predictions for each value of x
● In case of a factor, these unique values of x are the groups (eg SPSS, JASP, R)
● We use the group means as predicted scores for each observation
○ grade JASP=7.375
○ grade SPSS =7.175
○ grade R =7.975
Prediction errors: e= y −^
y i= y− y i
Using the observed score (y), the overall mean ( y ❑) and the group means ( y i), we can distinguish the
…
Learning Objectives:
● Explain when you would use analysis of variance (ANOVA)
● Interpret the sums of squares in an ANOVA
● Tests hypotheses about the association between a quantitative outcome and one categorical
predictor
● Test the differences between > 2 group means while controlling the Type-1 error rate
● Explain how significance tests and post-hoc comparisons for ANOVA function
Eg Do assignments grades differ across students who work with SPSS, JASP or R?
Descriptive Statistics: comparing >2 means
(1) Analysis of Variance (ANOVA): comparing >2 means
F-test to compare group means
H 0 :μ 1=μ2=μ3
HA : μI ≠ μJ
Rule 1: without any information about explanatory variables, our best prediction is the mean
● y=grade=7.475
Rule 2: we can make unique predictions for each value of x
● In case of a factor, these unique values of x are the groups (eg SPSS, JASP, R)
● We use the group means as predicted scores for each observation
○ grade JASP=7.375
○ grade SPSS =7.175
○ grade R =7.975
Prediction errors: e= y −^
y i= y− y i
Using the observed score (y), the overall mean ( y ❑) and the group means ( y i), we can distinguish the
…