The Science of Macroeconomics
Key Insights
• Macroeconomics bridges daily experiences, political outcomes, and global policies.
• Its insights guide both policymakers and individuals in understanding economic
behavior.
Macroeconomics as an Imperfect Science
• Predicting future economic events is as challenging as predicting weather, but
macroeconomists excel in understanding how economies work.
How Economists Think
Objective Approach:
• Economists tackle politically charged topics scientifically, using data and tools.
Theories as Models:
• Models are simplified representations of reality (like toys for children), used to
understand and predict economic relationships.
Examples:
• GDP, inflation, and unemployment relationships.
• Impact of fiscal and monetary policies.
Graphs and Their Role in Understanding Data
• Economists use graphs to represent trends in GDP, unemployment, and inflation over
time.
Example:
• Fluctuating unemployment rates demonstrate the constant changes in the economy.
Economic Models: Endogenous and Exogenous Variables
• Endogenous Variables: These are the outputs of the model that it aims to
explain.
• Exogenous Variables: These are external factors taken as given and influence
the endogenous variables.
Purpose of Models:
• Models are simplified frameworks that help understand how exogenous
variables influence endogenous variables.
• They focus on key relationships, ignoring irrelevant details.
,The Supply and Demand Model
• Scenario: An economist studies factors affecting the price and quantity of pizza.
• Demand Function:
• Q^d : Quantity of pizza demanded.
• P : Price of pizza.
• Y : Aggregate income.
• Supply Function:
• Q^s : Quantity of pizza supplied.
• Pm : Prices of materials (cheese, flour, etc.).
• Equilibrium Condition:
• Assumes the price adjusts to balance supply and demand.
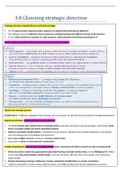
Supply and Demand Curve Exogenous and Endogenous Variables in the Model
Demand Curve: • Exogenous Variables:
• Downward sloping. • Aggregate income ( Y ).
• Shows that higher prices reduce • Prices of materials ( Pm ).
quantity demanded as consumers opt for • Endogenous Variables:
alternatives. • Price of pizza ( P ).
Supply Curve: • Quantity of pizza sold ( Q ).
• Upward sloping.
• Indicates that higher prices make
selling pizza more profitable, encouraging
increased production.
Market Equilibrium:
• The point where the supply and
demand curves intersect.
• Defines the equilibrium price and
quantity in the market.
, Like all models, this model of the
pizza market makes simplifying
assumptions. It assumes, for
instance, that there is a single
price for pizza. This assumption
ignores the fact that every
pizzeria is in a different location.
For the customers in any given
vicinity, one pizzeria is closer and
more convenient than the others.
As a result, pizzerias have some
ability to set their own prices,
and different pizzerias could
charge different prices for pizza,
contrary to the modelʼs
assumption of a single price.
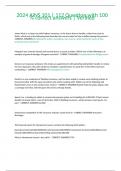
Market clearing — assumption that markets are normally in equilibrium, so
the price of any good or service is found where the supply and demand
curves intersect.
(Long-run)
Not continuous because wages and prices are not always flexible sometimes
they are sticky
(Short-run)
Microeconomics is the study of how households and firms make decisions and how
these decisionmakers interact in the marketplace.
macroeconomic theory rests on a microeconomic foundation.
, The Data of Macroeconomics
Measuring the Value of Economic Activity: Gross Domestic Product
One way to view GDP is as the total income of everyone in the economy;
the other is as the total expenditure on the economy’s output of goods
and services.
A stock is a quantity measured at a given point in time, whereas a flow is a
quantity measured per unit of time.
A person’s wealth is a stock; his income and expenditure are flows.
The number of unemployed people is a stock; the number of people losing their jobs
is a flow.
Rules for Computing GDP
Gross domestic product (GDP) is the market value of all final goods and services
produced within an economy in a given period of time.
Key Insights
• Macroeconomics bridges daily experiences, political outcomes, and global policies.
• Its insights guide both policymakers and individuals in understanding economic
behavior.
Macroeconomics as an Imperfect Science
• Predicting future economic events is as challenging as predicting weather, but
macroeconomists excel in understanding how economies work.
How Economists Think
Objective Approach:
• Economists tackle politically charged topics scientifically, using data and tools.
Theories as Models:
• Models are simplified representations of reality (like toys for children), used to
understand and predict economic relationships.
Examples:
• GDP, inflation, and unemployment relationships.
• Impact of fiscal and monetary policies.
Graphs and Their Role in Understanding Data
• Economists use graphs to represent trends in GDP, unemployment, and inflation over
time.
Example:
• Fluctuating unemployment rates demonstrate the constant changes in the economy.
Economic Models: Endogenous and Exogenous Variables
• Endogenous Variables: These are the outputs of the model that it aims to
explain.
• Exogenous Variables: These are external factors taken as given and influence
the endogenous variables.
Purpose of Models:
• Models are simplified frameworks that help understand how exogenous
variables influence endogenous variables.
• They focus on key relationships, ignoring irrelevant details.
,The Supply and Demand Model
• Scenario: An economist studies factors affecting the price and quantity of pizza.
• Demand Function:
• Q^d : Quantity of pizza demanded.
• P : Price of pizza.
• Y : Aggregate income.
• Supply Function:
• Q^s : Quantity of pizza supplied.
• Pm : Prices of materials (cheese, flour, etc.).
• Equilibrium Condition:
• Assumes the price adjusts to balance supply and demand.
Supply and Demand Curve Exogenous and Endogenous Variables in the Model
Demand Curve: • Exogenous Variables:
• Downward sloping. • Aggregate income ( Y ).
• Shows that higher prices reduce • Prices of materials ( Pm ).
quantity demanded as consumers opt for • Endogenous Variables:
alternatives. • Price of pizza ( P ).
Supply Curve: • Quantity of pizza sold ( Q ).
• Upward sloping.
• Indicates that higher prices make
selling pizza more profitable, encouraging
increased production.
Market Equilibrium:
• The point where the supply and
demand curves intersect.
• Defines the equilibrium price and
quantity in the market.
, Like all models, this model of the
pizza market makes simplifying
assumptions. It assumes, for
instance, that there is a single
price for pizza. This assumption
ignores the fact that every
pizzeria is in a different location.
For the customers in any given
vicinity, one pizzeria is closer and
more convenient than the others.
As a result, pizzerias have some
ability to set their own prices,
and different pizzerias could
charge different prices for pizza,
contrary to the modelʼs
assumption of a single price.
Market clearing — assumption that markets are normally in equilibrium, so
the price of any good or service is found where the supply and demand
curves intersect.
(Long-run)
Not continuous because wages and prices are not always flexible sometimes
they are sticky
(Short-run)
Microeconomics is the study of how households and firms make decisions and how
these decisionmakers interact in the marketplace.
macroeconomic theory rests on a microeconomic foundation.
, The Data of Macroeconomics
Measuring the Value of Economic Activity: Gross Domestic Product
One way to view GDP is as the total income of everyone in the economy;
the other is as the total expenditure on the economy’s output of goods
and services.
A stock is a quantity measured at a given point in time, whereas a flow is a
quantity measured per unit of time.
A person’s wealth is a stock; his income and expenditure are flows.
The number of unemployed people is a stock; the number of people losing their jobs
is a flow.
Rules for Computing GDP
Gross domestic product (GDP) is the market value of all final goods and services
produced within an economy in a given period of time.