1
Graphing Functions of 2 Variables in ℝ3
Many things depend on more than 1 unknown (e.g. the cost of building a car,
volume of circular cylinder: 𝑉 = 𝜋𝑟 2 ℎ, etc).
Def. A real-valued function of 2 variables (or 𝑛 variables) is a rule that
assigns to each point (𝑥, 𝑦) in a domain, 𝐷, a real number denoted by
𝑓(𝑥, 𝑦). The set of values of 𝑓 is called the range = {𝑓(𝑥, 𝑦)| (𝑥, 𝑦) ∈ 𝐷}.
We often write: 𝑧 = 𝑓(𝑥, 𝑦)
Ex. 𝑓 (𝑥, 𝑦) = 𝑥 2 + 𝑦 2 − 3𝑒 𝑥 is a real valued function of 2 variables.
Def. A vector-valued function of 2 variables (or 𝑛 variables) is a rule that assigns
each point (𝑥, 𝑦) to a vector in ℝ𝑚 , 𝑚 > 1.
Ex. 𝑓 (𝑥, 𝑦) =< 𝑥 2 + 𝑦 2 , cos 𝑥 , sin 𝑦 > is a vector valued function of 2
variables.
Ex. 𝑓 (𝑡) =< cos 𝑡 , sin 𝑡 >, is a vector valued function of 1 variable.
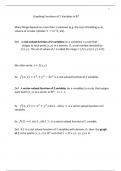
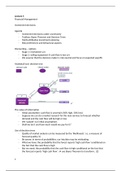
Def. If 𝑓 is a real valued function of 2 variables with domain, 𝐷, then the graph
of 𝒇 is the points (𝑥, 𝑦, 𝑧) ∈ ℝ3 such that 𝑧 = 𝑓(𝑥, 𝑦), (𝑥, 𝑦) ∈ 𝐷.
, 2
The graph of 𝑦 = 𝑓(𝑥) is a curve in ℝ2
𝑦 = 𝑥2
The graph of 𝑧 = 𝑓(𝑥, 𝑦) is a surface in ℝ3
𝑧 = 𝑥2 + 𝑦2
𝑦
𝑥
Graphing Functions of 2 Variables in ℝ3
Many things depend on more than 1 unknown (e.g. the cost of building a car,
volume of circular cylinder: 𝑉 = 𝜋𝑟 2 ℎ, etc).
Def. A real-valued function of 2 variables (or 𝑛 variables) is a rule that
assigns to each point (𝑥, 𝑦) in a domain, 𝐷, a real number denoted by
𝑓(𝑥, 𝑦). The set of values of 𝑓 is called the range = {𝑓(𝑥, 𝑦)| (𝑥, 𝑦) ∈ 𝐷}.
We often write: 𝑧 = 𝑓(𝑥, 𝑦)
Ex. 𝑓 (𝑥, 𝑦) = 𝑥 2 + 𝑦 2 − 3𝑒 𝑥 is a real valued function of 2 variables.
Def. A vector-valued function of 2 variables (or 𝑛 variables) is a rule that assigns
each point (𝑥, 𝑦) to a vector in ℝ𝑚 , 𝑚 > 1.
Ex. 𝑓 (𝑥, 𝑦) =< 𝑥 2 + 𝑦 2 , cos 𝑥 , sin 𝑦 > is a vector valued function of 2
variables.
Ex. 𝑓 (𝑡) =< cos 𝑡 , sin 𝑡 >, is a vector valued function of 1 variable.
Def. If 𝑓 is a real valued function of 2 variables with domain, 𝐷, then the graph
of 𝒇 is the points (𝑥, 𝑦, 𝑧) ∈ ℝ3 such that 𝑧 = 𝑓(𝑥, 𝑦), (𝑥, 𝑦) ∈ 𝐷.
, 2
The graph of 𝑦 = 𝑓(𝑥) is a curve in ℝ2
𝑦 = 𝑥2
The graph of 𝑧 = 𝑓(𝑥, 𝑦) is a surface in ℝ3
𝑧 = 𝑥2 + 𝑦2
𝑦
𝑥