Tableau Desktop Specialist - Questions With Verified
Solutions
If you have a dashboard and are displaying its filter, how can you rearrange it?
Right Ans - By clicking on the 2 lines on top and dragging the filter.
Which of the following can help us focus on specific data without removing
data in the visualization? Right Ans - Highlighters
A union of two tables usually results in an _____________________ Right Ans -
increase in the number of rows
Which of the following calculations DO NOT need a quick table calculation?
Right Ans - Variance and Standard Deviation
While borders and background colors let you visually highlight items on a
dashboard, _________ lets you precisely space items. Right Ans - padding
How can you add color to marks in the view in Tableau? Right Ans - From
the Data pane, drag a field to Color on the Marks card.
Which of the following are valid Dashboard size options? Right Ans -
Range, Automatic, Fixed Size
A Tableau Data Source File (.tds) contains which of the following? Right
Ans - Calculated Fields, Default Field Properties, and Data Source Type
Which of the following options best describe measures? Right Ans - They
are numerical, quantitative
If you see a Blue field, generally it will add _____________ to the view Right
Ans - headers
Which of the following are valid reasons to use a Tableau Data Extract (.tde)
over Live Connections? Right Ans - Help to improve performance, fast to
create, and to support additional functionality such as count distinct
,Which of the following are valid Layout Container types when using
Dashboards in Tableau? Right Ans - Horizontal and Vertical Container
What do the colours Blue and Green represent in Tableau? Right Ans -
Discrete and Continuous
Which of the following sets would you use to compare the members? Right
Ans - Combined Sets
Which of the following are true about dimensions? Right Ans - They affect
the level of detail in the view, they contain qualitative values (such as names,
dates, or geographical data), and dates are mostly placed in dimensions by
default for relational data sources
Which of the following are valid way(s) to make either of Rows or Columns
Bold without affecting the other? Right Ans - Right click on Rows or
Columns, and choose format. In the Font option click on Bold and Choose
Format from the Menu bar, select Row or Column, and then select Bold under
the header option
Which of the following are true about Dashboards in Tableau? Right Ans -
Tiled items don't overlap, Floating items can be layered over other objects,
and A bar chart can be used a floating item
Which of the following describes the best way to change the formatting at a
workbook level? Right Ans - Choose Format from the menu on top and then
specify the formatting in the new Format workbook pane.
How can you format an axis as Bold in Tableau? Right Ans - By right
clicking on the axis, choosing format, and then setting its font to bold.
In which of the following scenarios would having a live connection be more
beneficial than using an extract? Right Ans - Analyzing real time data from
production systems, Analyzing real time stock prices, and Analyzing and
tracking real time flight updates
For which of the following charts, does the Size option on the Marks card not
work? Right Ans - Tree Map
, Are animations enabled by default in Tableau? Right Ans - No
When field names in the Union do not match, then: Right Ans - Both field
names are present in the Union, but contain several null values
Is it possible to make a Measure discrete? Right Ans - Yes
When is an axis created for the visualisation in Tableau? Right Ans - When
we drag a continuous field to the row/column shelf
Which of the following are valid ways to italicize Tooltip content in Tableau?
Right Ans - Click on Worksheet in the Menu bar, select Tooltip, and then use
the italics option, Click on Format in the Menu bar, choose Font, and then edit
the Tooltip options to italicize the font, Click on Tooltip in the Marks card,
select the text, and then use the Italics option
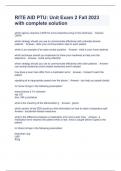
Suppose I have the following view. What will be the total number of marks if I
drag a new measure to the row shelf vs the column shelf? Right Ans - If
dragged to row shelf : 14 marks ; If dragged to column shelf : 7 marks
Suppose you create a bar chart by dragging a dimension to the Column shelf
and a measure to the Rows shelf. Which of the following would create a
stacked bar chart? Right Ans - By dragging another dimension to Color on
the Marks card
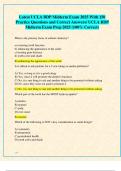
What does the following marker/icon do in Tableau? Right Ans - Toggle the
highlighting on/off.
What is a story point in Tableau? Right Ans - A single worksheet or
dashboard
Which of the following are valid ways to make the font more readable in
Tableau? Right Ans - Increase the font size, Make the Font color sharper /
darker than the background, Use a clear and readable font
Which of the following are valid ways to export a dashboard with multiple
visualisations as an image? Right Ans - Click on Dashboard in the Menu bar
followed by Copy Image
Solutions
If you have a dashboard and are displaying its filter, how can you rearrange it?
Right Ans - By clicking on the 2 lines on top and dragging the filter.
Which of the following can help us focus on specific data without removing
data in the visualization? Right Ans - Highlighters
A union of two tables usually results in an _____________________ Right Ans -
increase in the number of rows
Which of the following calculations DO NOT need a quick table calculation?
Right Ans - Variance and Standard Deviation
While borders and background colors let you visually highlight items on a
dashboard, _________ lets you precisely space items. Right Ans - padding
How can you add color to marks in the view in Tableau? Right Ans - From
the Data pane, drag a field to Color on the Marks card.
Which of the following are valid Dashboard size options? Right Ans -
Range, Automatic, Fixed Size
A Tableau Data Source File (.tds) contains which of the following? Right
Ans - Calculated Fields, Default Field Properties, and Data Source Type
Which of the following options best describe measures? Right Ans - They
are numerical, quantitative
If you see a Blue field, generally it will add _____________ to the view Right
Ans - headers
Which of the following are valid reasons to use a Tableau Data Extract (.tde)
over Live Connections? Right Ans - Help to improve performance, fast to
create, and to support additional functionality such as count distinct
,Which of the following are valid Layout Container types when using
Dashboards in Tableau? Right Ans - Horizontal and Vertical Container
What do the colours Blue and Green represent in Tableau? Right Ans -
Discrete and Continuous
Which of the following sets would you use to compare the members? Right
Ans - Combined Sets
Which of the following are true about dimensions? Right Ans - They affect
the level of detail in the view, they contain qualitative values (such as names,
dates, or geographical data), and dates are mostly placed in dimensions by
default for relational data sources
Which of the following are valid way(s) to make either of Rows or Columns
Bold without affecting the other? Right Ans - Right click on Rows or
Columns, and choose format. In the Font option click on Bold and Choose
Format from the Menu bar, select Row or Column, and then select Bold under
the header option
Which of the following are true about Dashboards in Tableau? Right Ans -
Tiled items don't overlap, Floating items can be layered over other objects,
and A bar chart can be used a floating item
Which of the following describes the best way to change the formatting at a
workbook level? Right Ans - Choose Format from the menu on top and then
specify the formatting in the new Format workbook pane.
How can you format an axis as Bold in Tableau? Right Ans - By right
clicking on the axis, choosing format, and then setting its font to bold.
In which of the following scenarios would having a live connection be more
beneficial than using an extract? Right Ans - Analyzing real time data from
production systems, Analyzing real time stock prices, and Analyzing and
tracking real time flight updates
For which of the following charts, does the Size option on the Marks card not
work? Right Ans - Tree Map
, Are animations enabled by default in Tableau? Right Ans - No
When field names in the Union do not match, then: Right Ans - Both field
names are present in the Union, but contain several null values
Is it possible to make a Measure discrete? Right Ans - Yes
When is an axis created for the visualisation in Tableau? Right Ans - When
we drag a continuous field to the row/column shelf
Which of the following are valid ways to italicize Tooltip content in Tableau?
Right Ans - Click on Worksheet in the Menu bar, select Tooltip, and then use
the italics option, Click on Format in the Menu bar, choose Font, and then edit
the Tooltip options to italicize the font, Click on Tooltip in the Marks card,
select the text, and then use the Italics option
Suppose I have the following view. What will be the total number of marks if I
drag a new measure to the row shelf vs the column shelf? Right Ans - If
dragged to row shelf : 14 marks ; If dragged to column shelf : 7 marks
Suppose you create a bar chart by dragging a dimension to the Column shelf
and a measure to the Rows shelf. Which of the following would create a
stacked bar chart? Right Ans - By dragging another dimension to Color on
the Marks card
What does the following marker/icon do in Tableau? Right Ans - Toggle the
highlighting on/off.
What is a story point in Tableau? Right Ans - A single worksheet or
dashboard
Which of the following are valid ways to make the font more readable in
Tableau? Right Ans - Increase the font size, Make the Font color sharper /
darker than the background, Use a clear and readable font
Which of the following are valid ways to export a dashboard with multiple
visualisations as an image? Right Ans - Click on Dashboard in the Menu bar
followed by Copy Image