MICROECONOMICS
by Robert S. Pindyck
Daniel Rubinfeld
Ninth Edition
Copyright © 2018 Pearson Education, Ltd, All Rights Reserved
,Chapter 9
The Analysis of Competitive Markets
In this chapter we return to supply–demand CHAPTER OUTLINE
analysis to show how it can be applied to a 9.1 Evaluating the Gains and Losses from
wide variety of problems, including situations in Government Policies—Consumer and
which: Producer Surplus
a consumer faced with a purchasing decision 9.2 The Efficiency of Competitive Markets
9.3 Minimum Prices
a firm faced with a long-range planning 9.4 Price Supports and Production Quotas
problem
9.5 Import Quotas and Tariffs
a government agency that has to design a 9.6 The Impact of a Tax or Subsidy
policy and evaluate its likely impact LIST OF EXAMPLES
We also use consumer and producer surplus 9.1 Price Controls and Natural Gas Shortages
to demonstrate the efficiency of a competitive 9.2 The Market for Human Kidneys
market. 9.3 Airline Regulation
9.4 Supporting the Price of Wheat
9.5 Why Can’t I Find a Taxi?
9.6 The Sugar Quota
9.7 A Tax on Gasoline
Copyright © 2018 Pearson Education, Ltd, All Rights Reserved
,9.1 Evaluating the Gains and Losses from Government
Policies—Consumer and Producer Surplus (1 of 4)
Review of Consumer and Producer Surplus
FIGURE 9.1 (1 of 2)
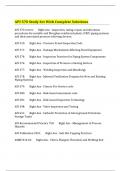
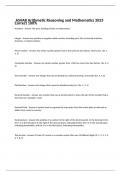
CONSUMER AND PRODUCER SURPLUS
Consumer A would pay $10 for a good whose
market price is $5 and therefore enjoys a
benefit of $5.
Consumer B enjoys a benefit of $2, and
Consumer C, who values the good at exactly
the market price, enjoys no benefit.
Consumer surplus, which measures the total
benefit to all consumers, is the yellow-shaded
area between the demand curve and the
market price.
Copyright © 2018 Pearson Education, Ltd, All Rights Reserved
, 9.1 Evaluating the Gains and Losses from Government
Policies—Consumer and Producer Surplus (2 of 4)
Review of Consumer and Producer Surplus
FIGURE 9.1 (2 of 2)
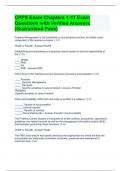
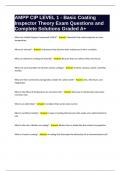
CONSUMER AND PRODUCER SURPLUS
Producer surplus measures the total profits of
producers, plus rents to factor inputs.
It is the benefit that lower-cost producers
enjoy by selling at the market price, shown by
the green-shaded area between the supply
curve and the market price.
Together, consumer and producer surplus
measure the welfare benefit of a competitive
market.
Copyright © 2018 Pearson Education, Ltd, All Rights Reserved
by Robert S. Pindyck
Daniel Rubinfeld
Ninth Edition
Copyright © 2018 Pearson Education, Ltd, All Rights Reserved
,Chapter 9
The Analysis of Competitive Markets
In this chapter we return to supply–demand CHAPTER OUTLINE
analysis to show how it can be applied to a 9.1 Evaluating the Gains and Losses from
wide variety of problems, including situations in Government Policies—Consumer and
which: Producer Surplus
a consumer faced with a purchasing decision 9.2 The Efficiency of Competitive Markets
9.3 Minimum Prices
a firm faced with a long-range planning 9.4 Price Supports and Production Quotas
problem
9.5 Import Quotas and Tariffs
a government agency that has to design a 9.6 The Impact of a Tax or Subsidy
policy and evaluate its likely impact LIST OF EXAMPLES
We also use consumer and producer surplus 9.1 Price Controls and Natural Gas Shortages
to demonstrate the efficiency of a competitive 9.2 The Market for Human Kidneys
market. 9.3 Airline Regulation
9.4 Supporting the Price of Wheat
9.5 Why Can’t I Find a Taxi?
9.6 The Sugar Quota
9.7 A Tax on Gasoline
Copyright © 2018 Pearson Education, Ltd, All Rights Reserved
,9.1 Evaluating the Gains and Losses from Government
Policies—Consumer and Producer Surplus (1 of 4)
Review of Consumer and Producer Surplus
FIGURE 9.1 (1 of 2)
CONSUMER AND PRODUCER SURPLUS
Consumer A would pay $10 for a good whose
market price is $5 and therefore enjoys a
benefit of $5.
Consumer B enjoys a benefit of $2, and
Consumer C, who values the good at exactly
the market price, enjoys no benefit.
Consumer surplus, which measures the total
benefit to all consumers, is the yellow-shaded
area between the demand curve and the
market price.
Copyright © 2018 Pearson Education, Ltd, All Rights Reserved
, 9.1 Evaluating the Gains and Losses from Government
Policies—Consumer and Producer Surplus (2 of 4)
Review of Consumer and Producer Surplus
FIGURE 9.1 (2 of 2)
CONSUMER AND PRODUCER SURPLUS
Producer surplus measures the total profits of
producers, plus rents to factor inputs.
It is the benefit that lower-cost producers
enjoy by selling at the market price, shown by
the green-shaded area between the supply
curve and the market price.
Together, consumer and producer surplus
measure the welfare benefit of a competitive
market.
Copyright © 2018 Pearson Education, Ltd, All Rights Reserved