66
CHAPTER 10
GRAPHICAL REPRESENTATION OF DATA
AIM: To construct the following graphs: scatter plot,
straight line, pie chart and bar chart.
10.1 WHERE DO I START WHEN CONSTRUCTING A GRAPH?
Graphs are used daily to represent data on a diagram. Examples of data often represented on
graphs are
S inflation rate
S gold price
S student marks.
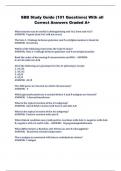
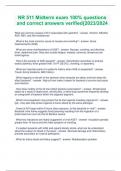
Draw the horizontal axis, called the x-axis, and the vertical axis, called the y-axis. The two lines
intersect with an angle of 90°/ at the position x = 0 and y = 0. This is called the origin of the
graph.
Figure 10.1
Note that left of the origin on the x-axis and beyond the origin on the y-axis, the scales become
negative.
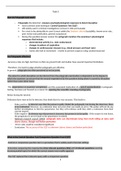
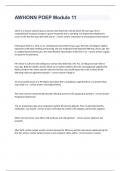
It is important to note that the scales of the two axis need not be the same.
Figure 10.2
, 67
10.2 HOW DO I CHOOSE A PROPER SCALE?
Depending on the data you want to represent, you must choose the best possible scales so that all
your data values would fit on the axis.
EXAMPLE 10.1
Values to be represented on the x-axis :
0 2 5 -3 -4 10 5 6 -6 8
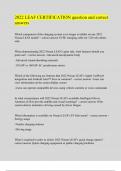
The maximum is 10 and the minimum is -6. Both these values should be included on the axis
# ____# ____# ____# ____# ____# ____#
-6 -3 0 3 6 9 12 Figure 10.3
# ____# ____# ____# ____# ____# ____# ____# ____# ____#
-6 -4 -2 0 2 4 6 8 10 12 Figure 10.4
Figure 10.3 and figure 10.4 will both be suitable for your data set.
# ____# ____# ____# ____# ____# ____# ____# ____#
-6 -4 -3 0 2 5 6 8 10 Figure 10.5
Figure 10.5 will not be a proper scale because it is not chosen in regular intervals.
Sometimes it will happen that only a certain range of values need to be represented on the x-axis or
the y-axis.
EXAMPLE 10.2
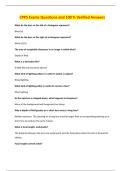
Values to be represented on the x-axis:
100 101 105 100 106 110 108 107 102 109
# ____# ____# ____# ____# ____# ____# ____# ____# ____# ____# ____#
0 10 20 30 40 50 60 70 80 90 100 110 Figure 10.6
Figure 10.6 will not be a suitable scale because all the values to be represented fall between 100 and
110 and only the top part of the diagram will be used.
# _ ___# ____# ____# ____# ____# ____# ____# ____# ____# ____#
0 101 102 103 104 105 106 107 108 109 110 Figure 10.7
Figure 11.7 will be a more suitable scale because the data will be better represented on the scale.
Note - indicate that there is a break on the axis.
CHAPTER 10
GRAPHICAL REPRESENTATION OF DATA
AIM: To construct the following graphs: scatter plot,
straight line, pie chart and bar chart.
10.1 WHERE DO I START WHEN CONSTRUCTING A GRAPH?
Graphs are used daily to represent data on a diagram. Examples of data often represented on
graphs are
S inflation rate
S gold price
S student marks.
Draw the horizontal axis, called the x-axis, and the vertical axis, called the y-axis. The two lines
intersect with an angle of 90°/ at the position x = 0 and y = 0. This is called the origin of the
graph.
Figure 10.1
Note that left of the origin on the x-axis and beyond the origin on the y-axis, the scales become
negative.
It is important to note that the scales of the two axis need not be the same.
Figure 10.2
, 67
10.2 HOW DO I CHOOSE A PROPER SCALE?
Depending on the data you want to represent, you must choose the best possible scales so that all
your data values would fit on the axis.
EXAMPLE 10.1
Values to be represented on the x-axis :
0 2 5 -3 -4 10 5 6 -6 8
The maximum is 10 and the minimum is -6. Both these values should be included on the axis
# ____# ____# ____# ____# ____# ____#
-6 -3 0 3 6 9 12 Figure 10.3
# ____# ____# ____# ____# ____# ____# ____# ____# ____#
-6 -4 -2 0 2 4 6 8 10 12 Figure 10.4
Figure 10.3 and figure 10.4 will both be suitable for your data set.
# ____# ____# ____# ____# ____# ____# ____# ____#
-6 -4 -3 0 2 5 6 8 10 Figure 10.5
Figure 10.5 will not be a proper scale because it is not chosen in regular intervals.
Sometimes it will happen that only a certain range of values need to be represented on the x-axis or
the y-axis.
EXAMPLE 10.2
Values to be represented on the x-axis:
100 101 105 100 106 110 108 107 102 109
# ____# ____# ____# ____# ____# ____# ____# ____# ____# ____# ____#
0 10 20 30 40 50 60 70 80 90 100 110 Figure 10.6
Figure 10.6 will not be a suitable scale because all the values to be represented fall between 100 and
110 and only the top part of the diagram will be used.
# _ ___# ____# ____# ____# ____# ____# ____# ____# ____# ____#
0 101 102 103 104 105 106 107 108 109 110 Figure 10.7
Figure 11.7 will be a more suitable scale because the data will be better represented on the scale.
Note - indicate that there is a break on the axis.