8/7/24, 3:22 PM Assessment 3 (page 9 of 9)
UNISA 2024 ECS1601-24-Y Online assessments Assessment 3
QUIZ
Question 17
Answer saved
Marked out of 1.00
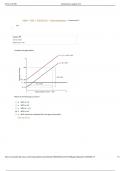
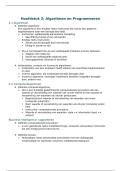
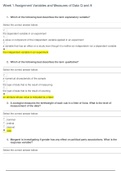
Consider the graph below:
Which of the following is correct?
a. MPC is 1/4
b. MPC is 5/4
c. MPS is 1-1/4
d. MPC is 4/5
e. MPC cannot be calculated from the given information
Clear my choice
https://mymodules.dtls.unisa.ac.za/mod/quiz/attempt.php?attempt=20664574&cmid=871349&page=8#question-20893562-18 1/2
,8/7/24, 3:22 PM Assessment 3 (page 9 of 9)
Question 18
Not yet answered
Marked out of 1.00
If the marginal propensity to consume is 0,6 which of the following statements
is correct?
a. It means that 60% of the increase in income is saved, while the
remaining 40% will be used for consumption.
b. It means that 60% of total income earned is saved.
c. It means that a change in income does not affect the marginal
propensity to consume.
d. It means that 60% of an increase in income will be used for
consumption, while the remaining 40% will be saved.
Clear my choice
https://mymodules.dtls.unisa.ac.za/mod/quiz/attempt.php?attempt=20664574&cmid=871349&page=8#question-20893562-18 2/2
,8/7/24, 3:20 PM Assessment 3 (page 1 of 9)
UNISA 2024 ECS1601-24-Y Online assessments Assessment 3
QUIZ
Question 1
Answer saved
Marked out of 1.00
If the newspaper reports that “the construction sector was responsible for 1,2% of the GDP growth”, then this implies that the
GDP has been measured according to the
a. expenditure method.
b. production method.
c. income method.
d. nominal prices method.
Clear my choice
Question 2
Answer saved
Marked out of 1.00
If GDP is greater than GDE,
a. the country has a deficit in the current account.
b. exports are greater than imports.
c. taxes are more than government expenditure.
d. the country is consuming more than it is producing.
Clear my choice
https://mymodules.dtls.unisa.ac.za/mod/quiz/attempt.php?attempt=20664574&cmid=871349 1/2
, 8/7/24, 3:20 PM Assessment 3 (page 1 of 9)
Question 3
Answer saved
Marked out of 1.00
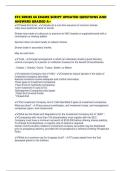
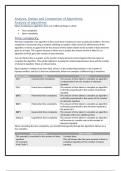
The question is based on the information below:
Source: World Bank, World Development Indicators (2019)
Based on the Lorenz Curve above, which country has the most unequal income distribution?
a. Sweden
b. South Africa
c. India
d. United States
Clear my choice
https://mymodules.dtls.unisa.ac.za/mod/quiz/attempt.php?attempt=20664574&cmid=871349 2/2
UNISA 2024 ECS1601-24-Y Online assessments Assessment 3
QUIZ
Question 17
Answer saved
Marked out of 1.00
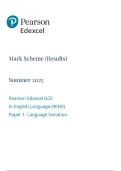
Consider the graph below:
Which of the following is correct?
a. MPC is 1/4
b. MPC is 5/4
c. MPS is 1-1/4
d. MPC is 4/5
e. MPC cannot be calculated from the given information
Clear my choice
https://mymodules.dtls.unisa.ac.za/mod/quiz/attempt.php?attempt=20664574&cmid=871349&page=8#question-20893562-18 1/2
,8/7/24, 3:22 PM Assessment 3 (page 9 of 9)
Question 18
Not yet answered
Marked out of 1.00
If the marginal propensity to consume is 0,6 which of the following statements
is correct?
a. It means that 60% of the increase in income is saved, while the
remaining 40% will be used for consumption.
b. It means that 60% of total income earned is saved.
c. It means that a change in income does not affect the marginal
propensity to consume.
d. It means that 60% of an increase in income will be used for
consumption, while the remaining 40% will be saved.
Clear my choice
https://mymodules.dtls.unisa.ac.za/mod/quiz/attempt.php?attempt=20664574&cmid=871349&page=8#question-20893562-18 2/2
,8/7/24, 3:20 PM Assessment 3 (page 1 of 9)
UNISA 2024 ECS1601-24-Y Online assessments Assessment 3
QUIZ
Question 1
Answer saved
Marked out of 1.00
If the newspaper reports that “the construction sector was responsible for 1,2% of the GDP growth”, then this implies that the
GDP has been measured according to the
a. expenditure method.
b. production method.
c. income method.
d. nominal prices method.
Clear my choice
Question 2
Answer saved
Marked out of 1.00
If GDP is greater than GDE,
a. the country has a deficit in the current account.
b. exports are greater than imports.
c. taxes are more than government expenditure.
d. the country is consuming more than it is producing.
Clear my choice
https://mymodules.dtls.unisa.ac.za/mod/quiz/attempt.php?attempt=20664574&cmid=871349 1/2
, 8/7/24, 3:20 PM Assessment 3 (page 1 of 9)
Question 3
Answer saved
Marked out of 1.00
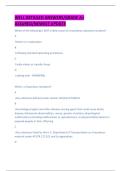
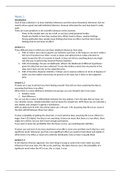
The question is based on the information below:
Source: World Bank, World Development Indicators (2019)
Based on the Lorenz Curve above, which country has the most unequal income distribution?
a. Sweden
b. South Africa
c. India
d. United States
Clear my choice
https://mymodules.dtls.unisa.ac.za/mod/quiz/attempt.php?attempt=20664574&cmid=871349 2/2