TUT 4 A on Chapter 17 PREPARATION
Questions 1
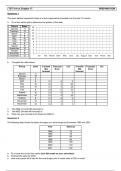
The given dataset represents sales at a local supermarket recorded over the past 12 months.
a. Do a time series plot to determine the pattern of the data.
Period Sales 18
January 11
16
February 13
March 9 14
April 8 12
May 16 10
June 15 8
July 8
6
August 10
September 15 4
October 8 2
November 10 0
December 12 Jan Feb March April May June July August Sepr Octr Nover Decr
b. Complete the table below:
Period sales 3-month Forecast 𝑺𝑺𝑺𝑺𝑺𝑺 5-month Forecast 𝑺𝑺𝑺𝑺𝑺𝑺
MA Error MA Error
forecast forecast
January 11
February 13
March 9
April 8 11 -3 9
May 16 10 6 36
June 15 11 4 16
July 8 13 -5 25
August 10 13 -3 9
September 15 11 4 16
October 8 11 -3 9
November 10 11 -1 1
December 12 11 1 1
c. The MSE (3-month MA forecast) is:
d. The MSE (5month MA forecast) is:
e. What can you conclude from these two MSE’s?
Questions 2
The following data shows the sales of burgers at a local burger joint between 1995 and 2001:
Year Sales (y)
1995 74
1996 79
1997 80
1998 90
1999 105
2000 142
2001 122
a. Fit a trend line to this time series [use Stat mode on your calculator]
b. Forecast the sales for 2003
c. How many years will it take for the local burger joint to reach sales of 200 or more?
Questions 1
The given dataset represents sales at a local supermarket recorded over the past 12 months.
a. Do a time series plot to determine the pattern of the data.
Period Sales 18
January 11
16
February 13
March 9 14
April 8 12
May 16 10
June 15 8
July 8
6
August 10
September 15 4
October 8 2
November 10 0
December 12 Jan Feb March April May June July August Sepr Octr Nover Decr
b. Complete the table below:
Period sales 3-month Forecast 𝑺𝑺𝑺𝑺𝑺𝑺 5-month Forecast 𝑺𝑺𝑺𝑺𝑺𝑺
MA Error MA Error
forecast forecast
January 11
February 13
March 9
April 8 11 -3 9
May 16 10 6 36
June 15 11 4 16
July 8 13 -5 25
August 10 13 -3 9
September 15 11 4 16
October 8 11 -3 9
November 10 11 -1 1
December 12 11 1 1
c. The MSE (3-month MA forecast) is:
d. The MSE (5month MA forecast) is:
e. What can you conclude from these two MSE’s?
Questions 2
The following data shows the sales of burgers at a local burger joint between 1995 and 2001:
Year Sales (y)
1995 74
1996 79
1997 80
1998 90
1999 105
2000 142
2001 122
a. Fit a trend line to this time series [use Stat mode on your calculator]
b. Forecast the sales for 2003
c. How many years will it take for the local burger joint to reach sales of 200 or more?